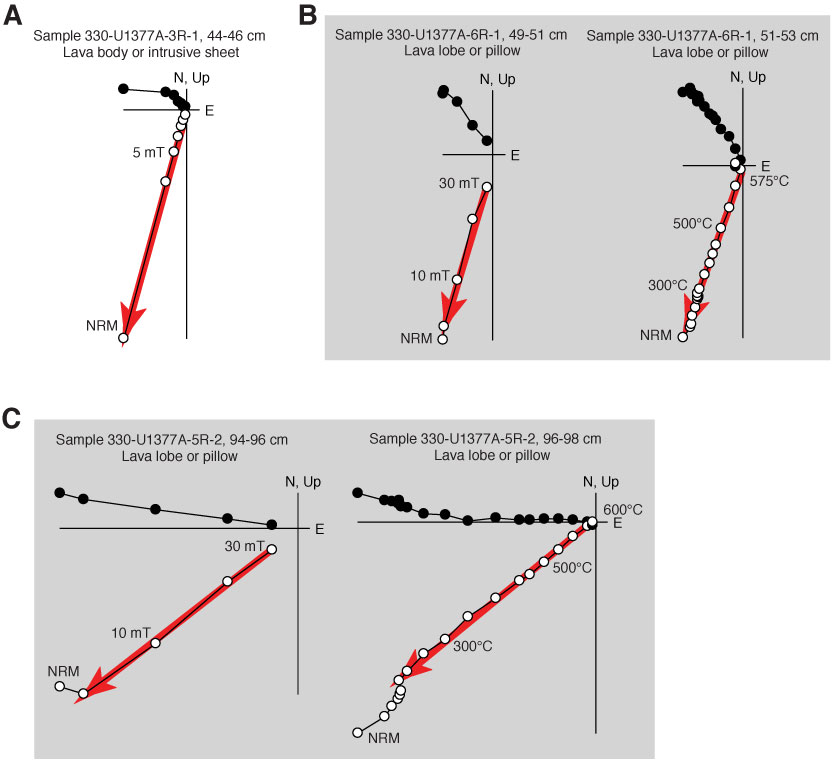
Figure F29. A–C. Representative Zijderveld plots of stepwise AF and thermal demagnetization results from discrete samples, Hole U1377A. Solid circles = projections of vector endpoints onto horizontal plane, open circles = projections onto vertical plane. Red arrows = best-fitting principal component analysis direction. Gray boxes indicate thermal and AF demagnetization results from adjacent samples. NRM = natural remanent magnetization.
Previous | Close | Next | Top of page