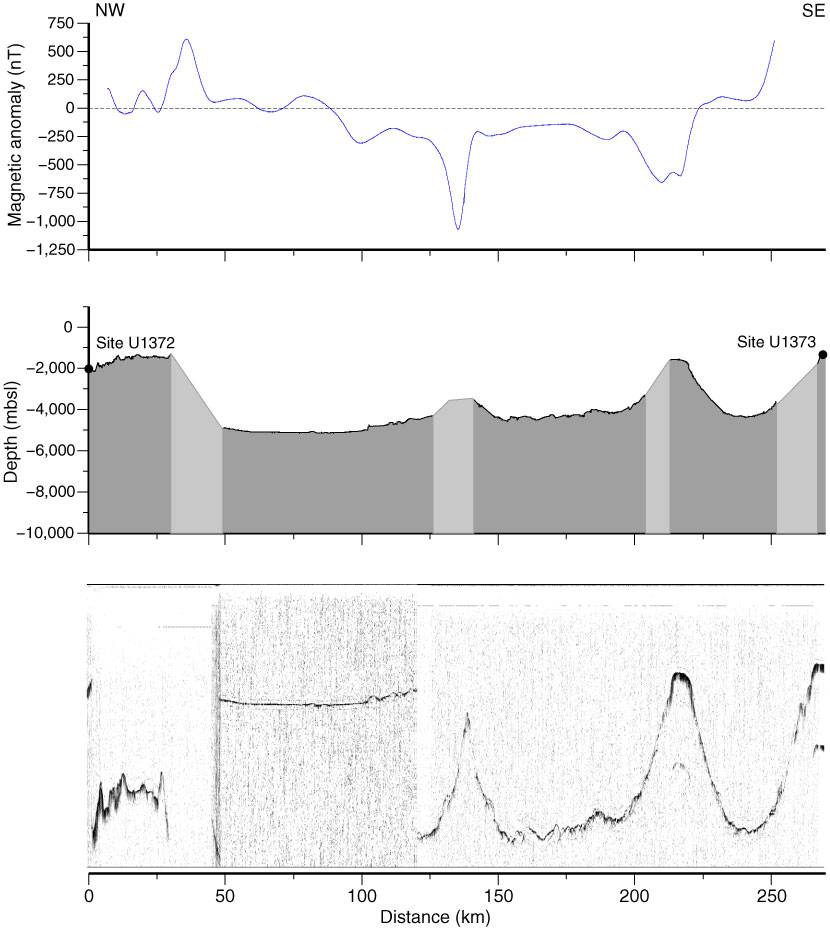
Figure F4. Magnetic anomaly, bathymetry, and echo sounder profiles of Transit L2T from Site U1372 to Site U1373. Gaps of >5 km in the bathymetry data are marked with pale gray shading. See Figure F2 for location.

Previous | Close | Next | Top of page