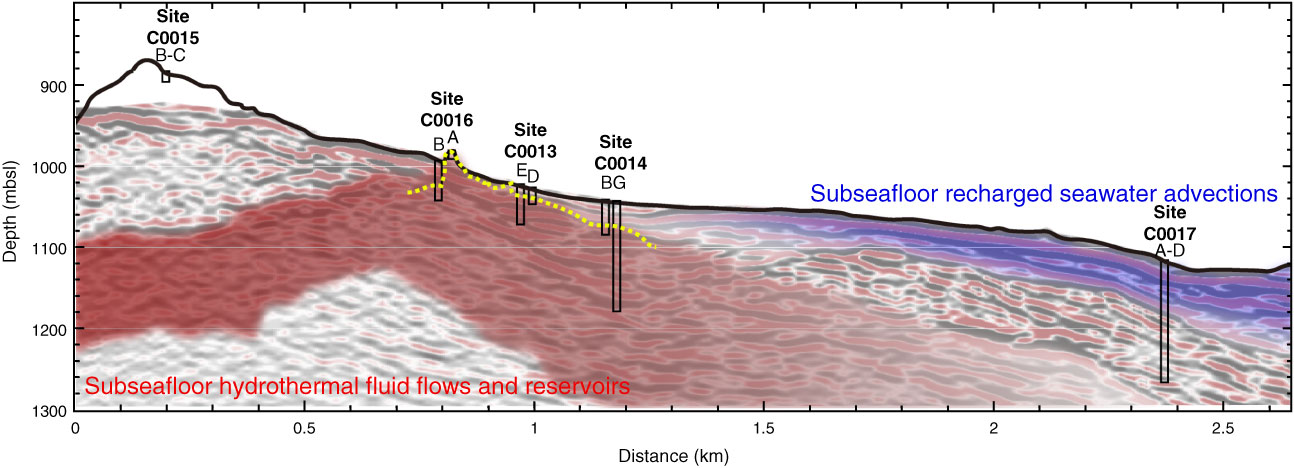
Figure F16. Schematic illustration of the possible spatial extent of subseafloor hydrothermal fluid flow and reservoirs (red) and recharged seawater advection (blue) based on preexisting seismic interpretation and drilling results from Expedition 331. Bars indicate the deeper holes drilled during Expedition 331 and their total penetration depths. The yellow dotted line denotes the shallowest depth of high temperatures of hydrothermal fluids we encountered during the expedition. Hole depths are fit to the seismic reflection profile assuming that 1 s two-way traveltime = 750 m.
Previous | Close | Top of page