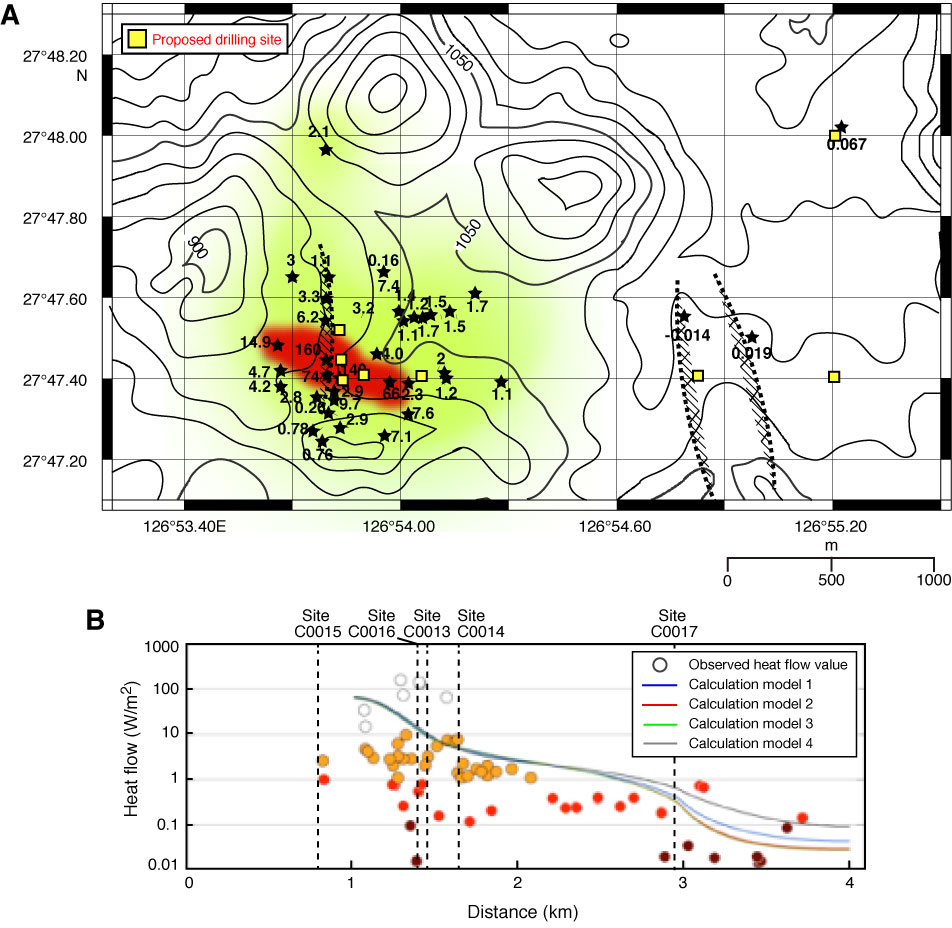
Figure F1. Two-dimensional heat flow anomalies of the Iheya North hydrothermal fields. A. Plot of horizontal variation in heat flow within the hydrothermal field and the central valley. B. Plot of estimated heat flow pattern in an east–west section through the hydrothermal field and the central valley.

Close | Next | Top of page