Previous | Close | Next
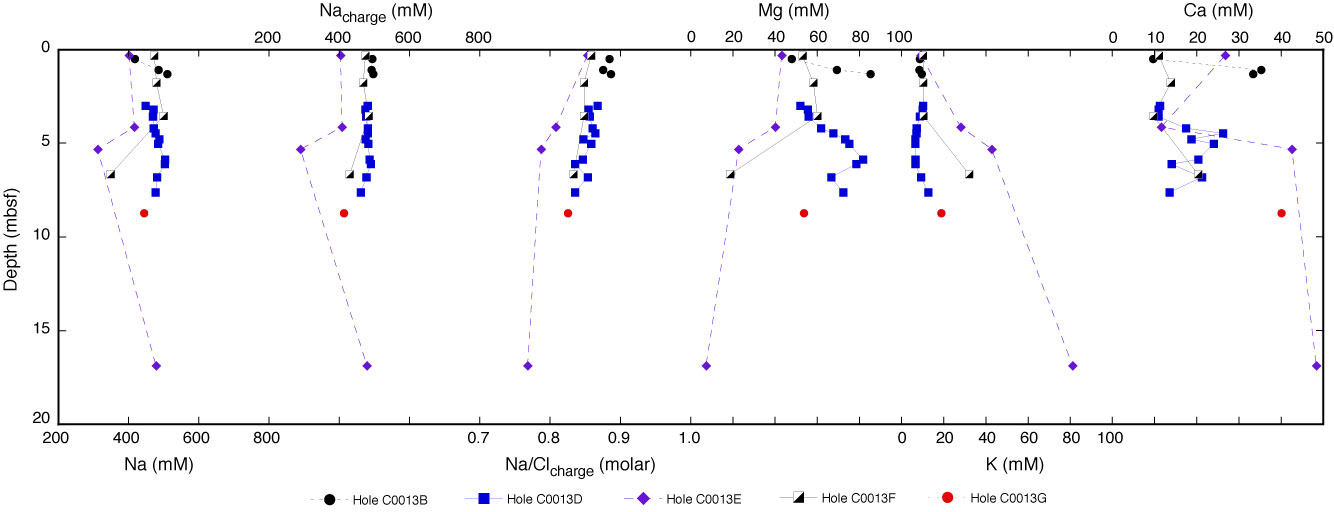
Figure F26. Plot of sodium by ion chromatography and by charge balance, Na/Cl molar ratio, K, Mg, and Ca in pore water, Site C0013.
Previous | Close | Next | Top of page