Previous | Close | Next
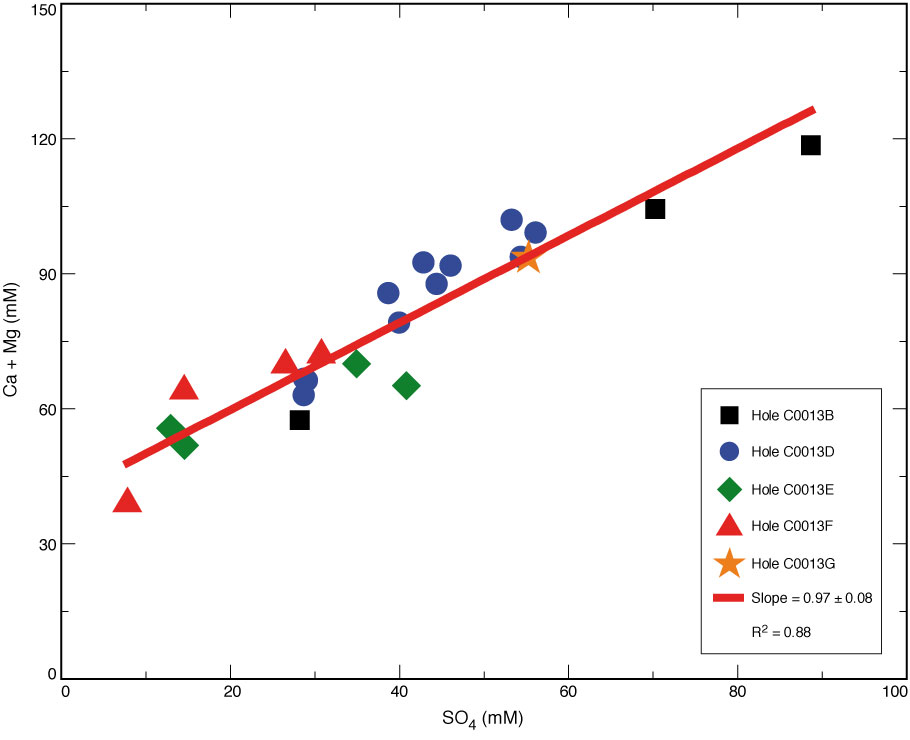
Figure F29. Plot of calcium plus magnesium in pore water plotted as a function of sulfate, Site C0013.
Previous | Close | Next | Top of page