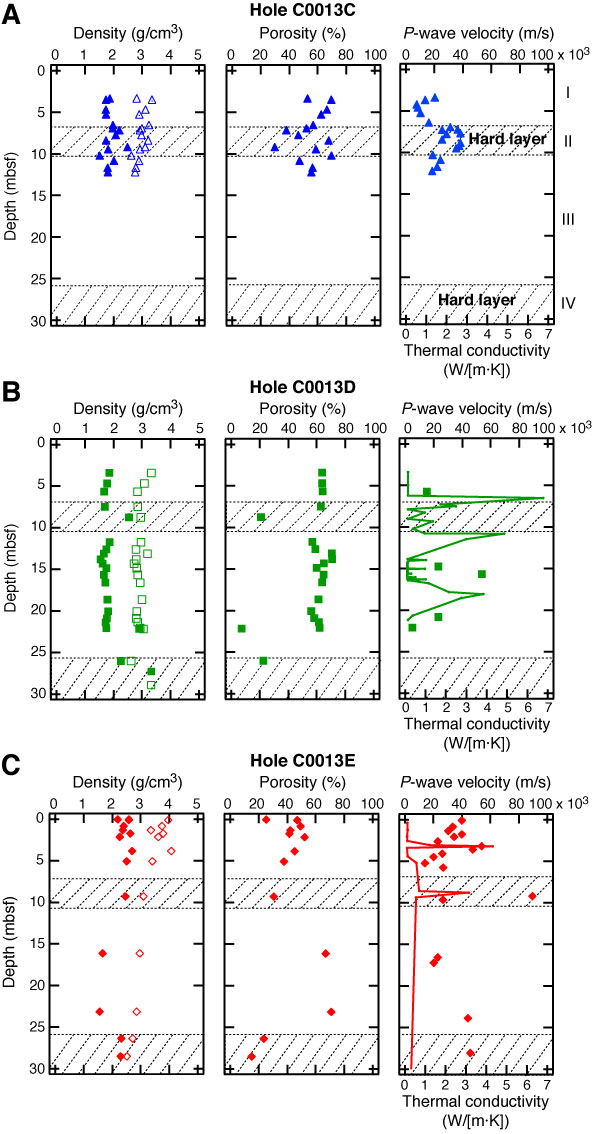
Figure F36. Comparison of physical properties parameters in Holes C0013C–C0013H. Density = wet bulk density (solid symbols) and grain density (open symbols). P-wave velocities are MSCL derived (lines). Thermal conductivity is shown as symbols. Dashed boxes represent the approximate extent of relatively dense layers with lithology different from the surrounding sediment, based on the presence of high bulk density, low porosity regions that also have increased thermal conductivity and P-wave velocities. Note the change in the P-wave velocity axis for Holes C0014F–C0014H. A. Hole C0013C. B. Hole C0013D. C. Hole C0013E. (Continued on next page.)
Previous | Close | Next | Top of page