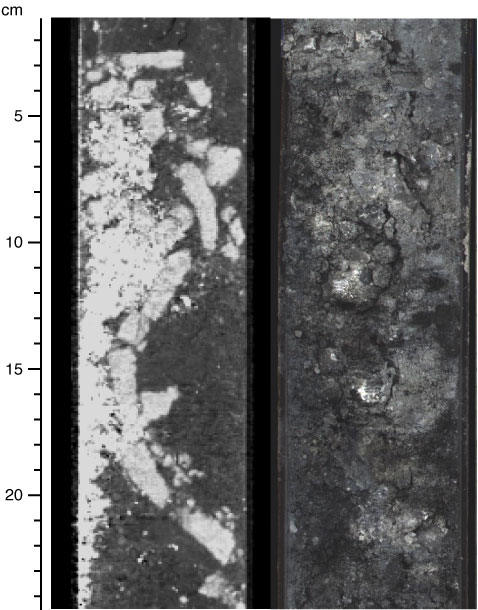
Figure F6. X-ray CT scan (left) and core photograph (right) of euhedral vein anhydrite disrupted by drilling (interval 331-C0013C-1H-5, 2–24 cm). Note the high-density response on X-ray CT due to the presence of sulfide minerals on the left side of the image.
Previous | Close | Next | Top of page