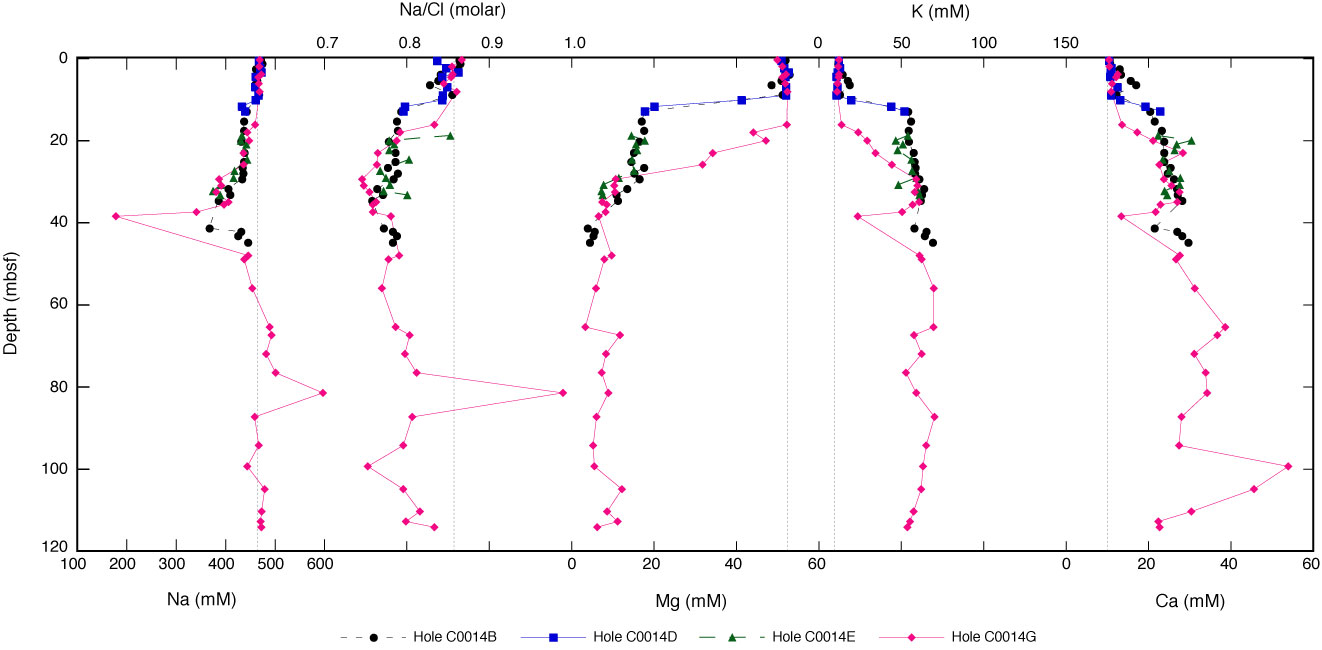
Figure F19. Plot of sodium, sodium to chloride ratio, magnesium, potassium, and calcium in pore water, Site C0014. Sodium is as measured by ion chromatography. Dashed lines represent concentrations in seawater.
Previous | Close | Next | Top of page