Previous | Close | Next
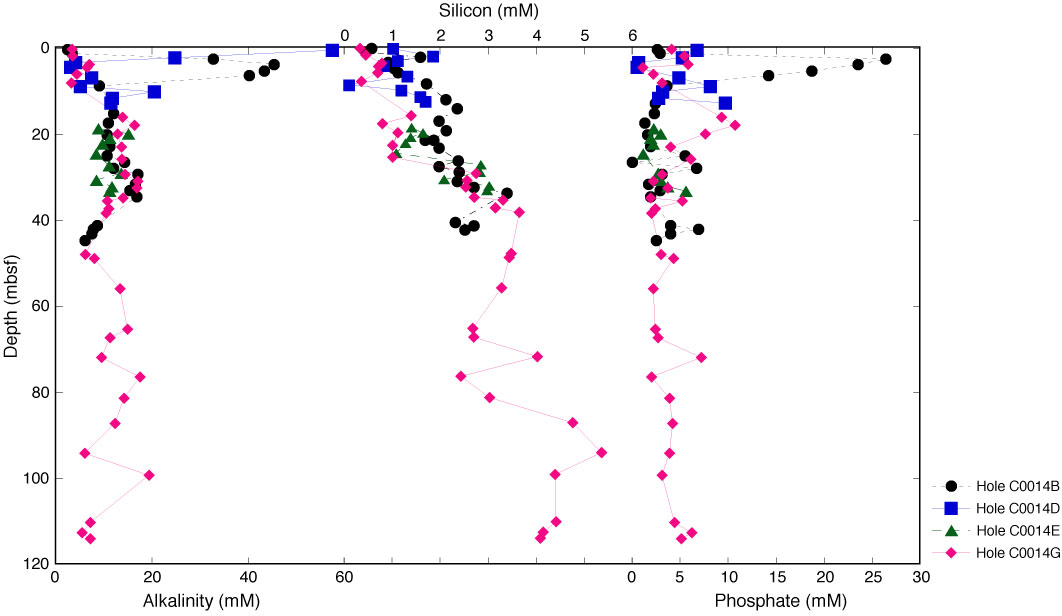
Figure F21. Plot of alkalinity, silicon (measured using colorimetry), and phosphate in pore water, Site C0014.
Previous | Close | Next | Top of page