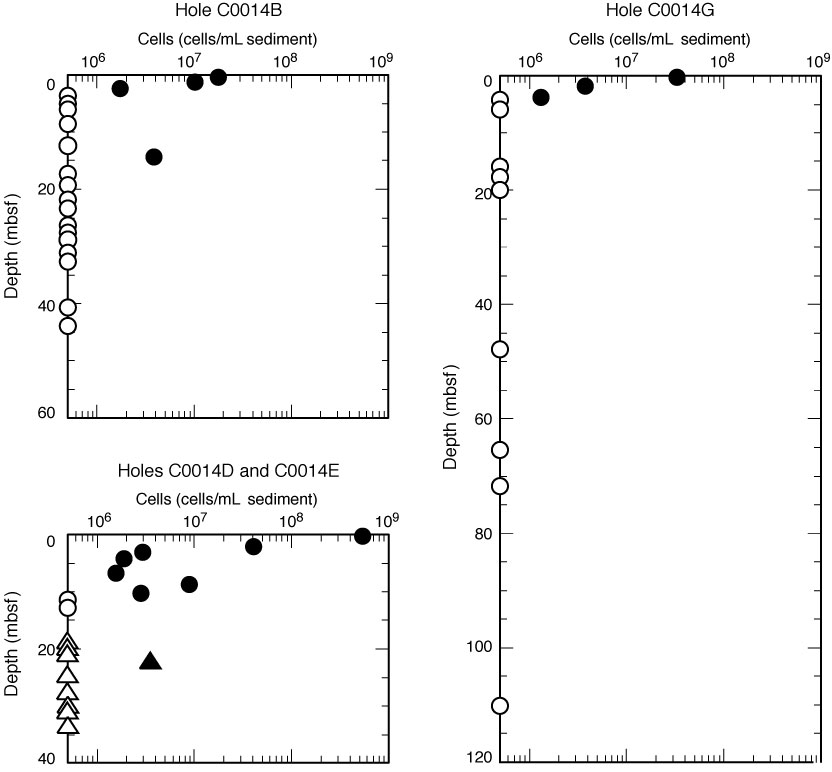
Figure F29. Plot of microbial cell counts from Site C0014. Sediment samples from Hole C0014E are shown as triangles. Open symbols indicate that cell abundance is below the detection limit of 1 × 10⁶ to 4 × 10⁶ cells/mL.
Previous | Close | Next | Top of page