Previous | Close | Next
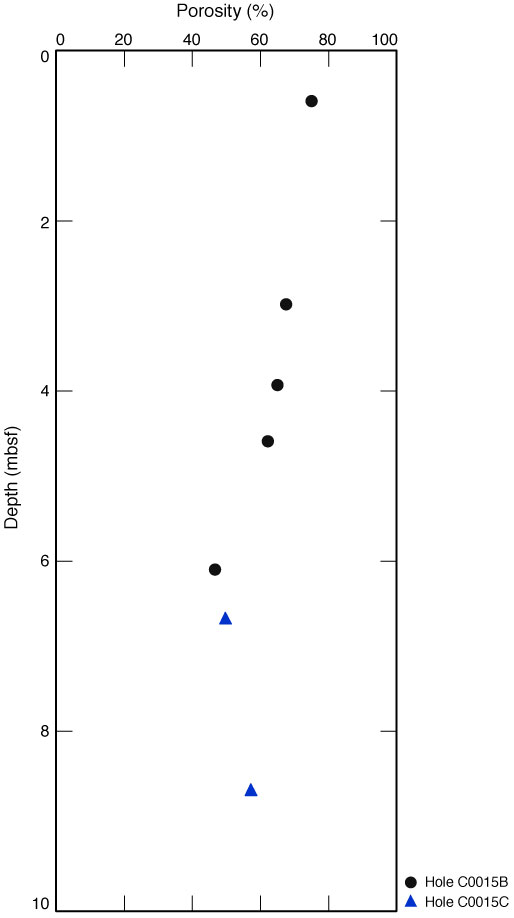
Figure F20. Plot of porosity calculated from discrete MAD measurements, Site C0015.
Previous | Close | Next | Top of page