Previous | Close | Next
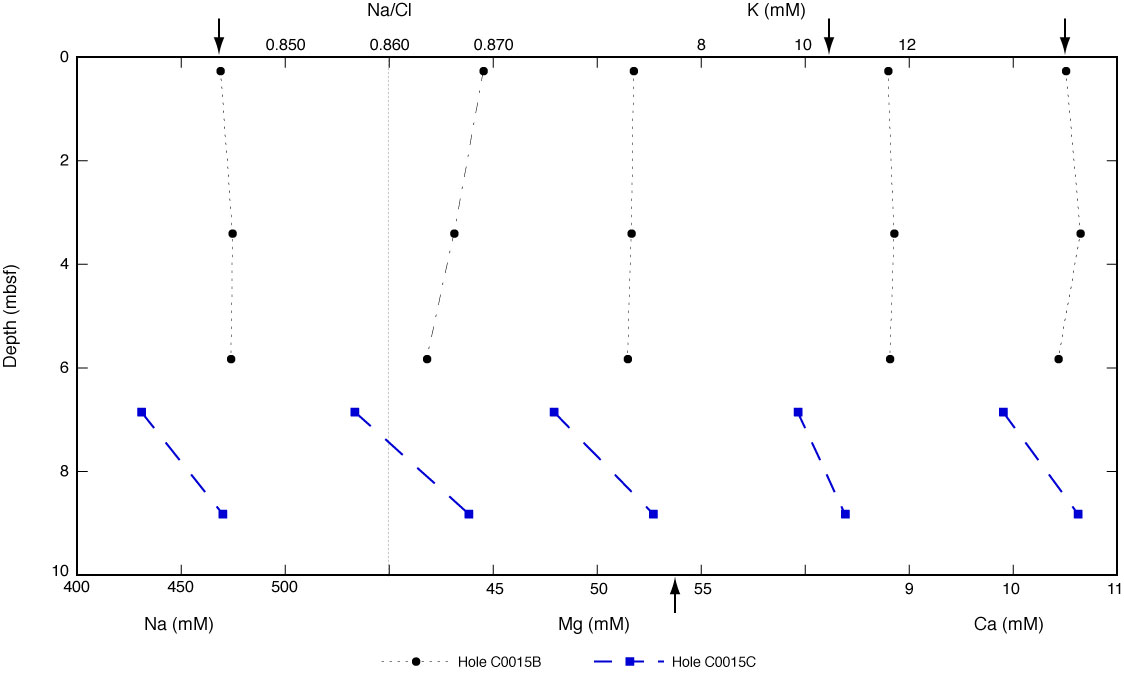
Figure F8. Depth profiles for sodium, sodium to chloride ratio, potassium, magnesium, and calcium in interstitial water at Site C0015. Arrows show seawater values, as does the dashed line for the Na/Cl ratio.
Previous | Close | Next | Top of page