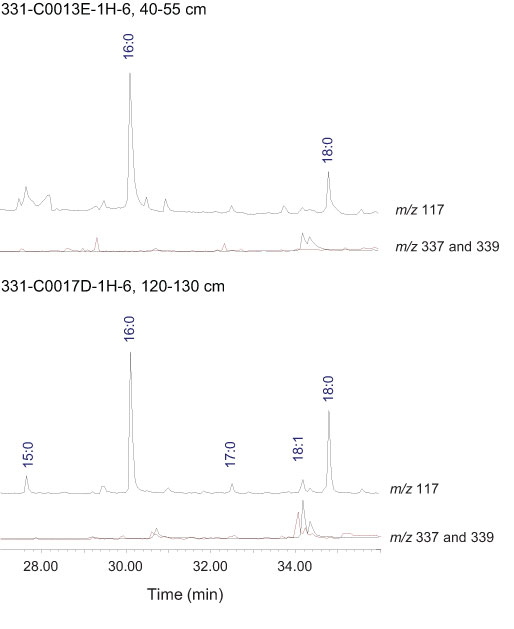
Figure F6. Ion chromatograms illustrating the abundance of n-alkanoic acids in two contrasting samples, Sites C0013 and C0017. The m/z 117 ion illustrates the abundance of n-alkanoic acids, whereas the m/z 337 and 339 ions illustrate the abundance of C18 alkenoic acids. 18:1 = C18 n-alkenoic acid.
Previous | Close | Next | Top of page