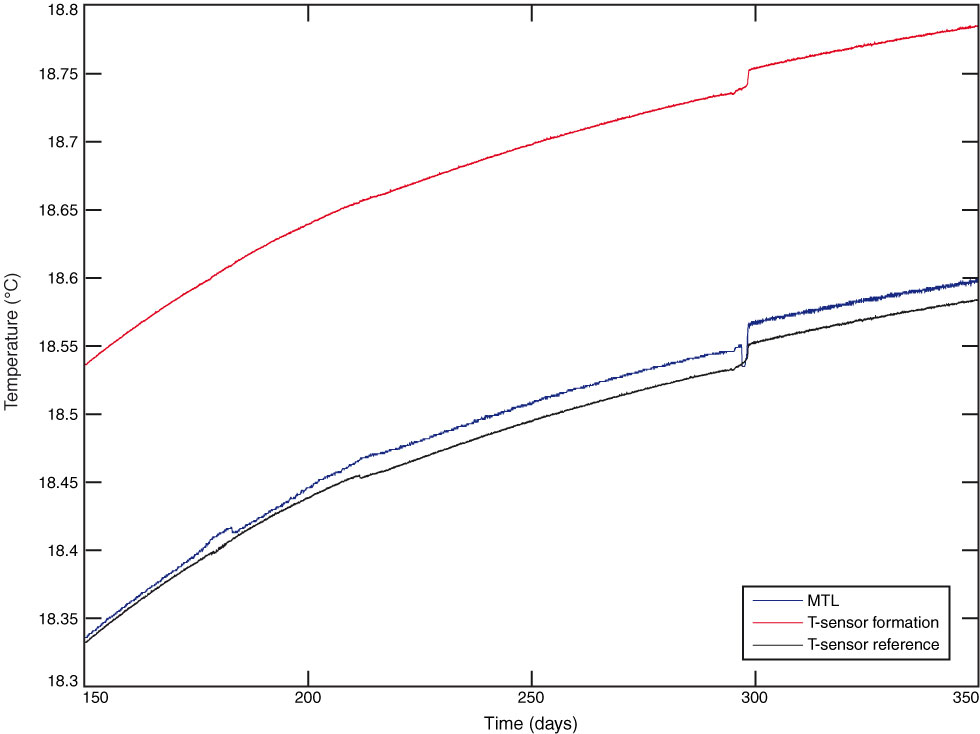
Figure F12. Example of temperature perturbations in late May 2010, Site C0010. It remains unresolved why three thermistors show a systematic increase by ~0.03°C, whereas one drops gently at the same time. MTL = miniature temperature logger.
Previous | Close | Next | Top of page