Previous | Close | Next
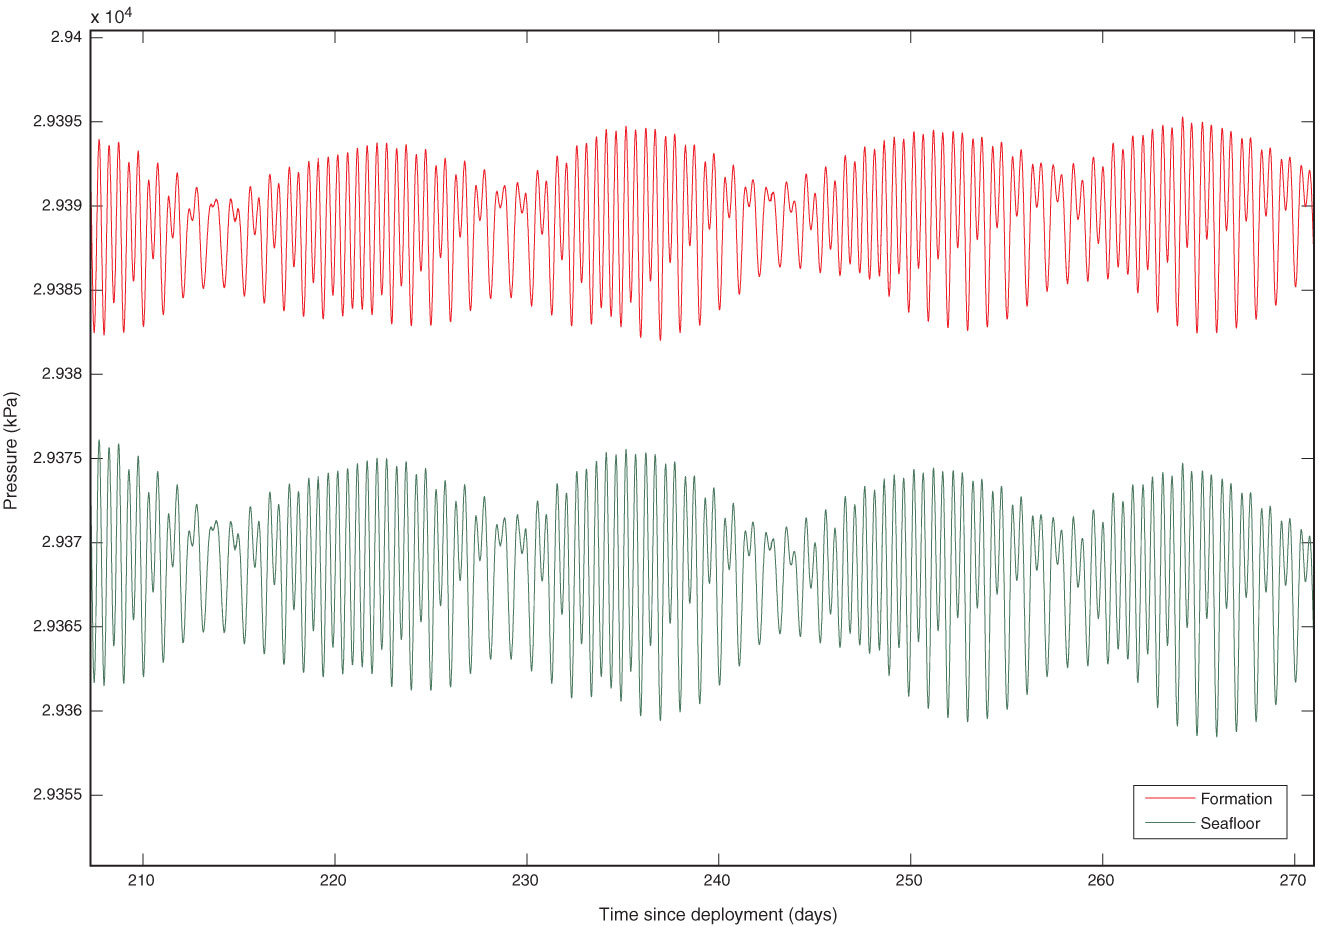
Figure F8. Two months of pressure data showing characteristic tidal forcing, Site C0010. Note diminished amplitude in formation data relative to seafloor (hydrostatic) response.
Previous | Close | Next | Top of page