Previous | Close | Next
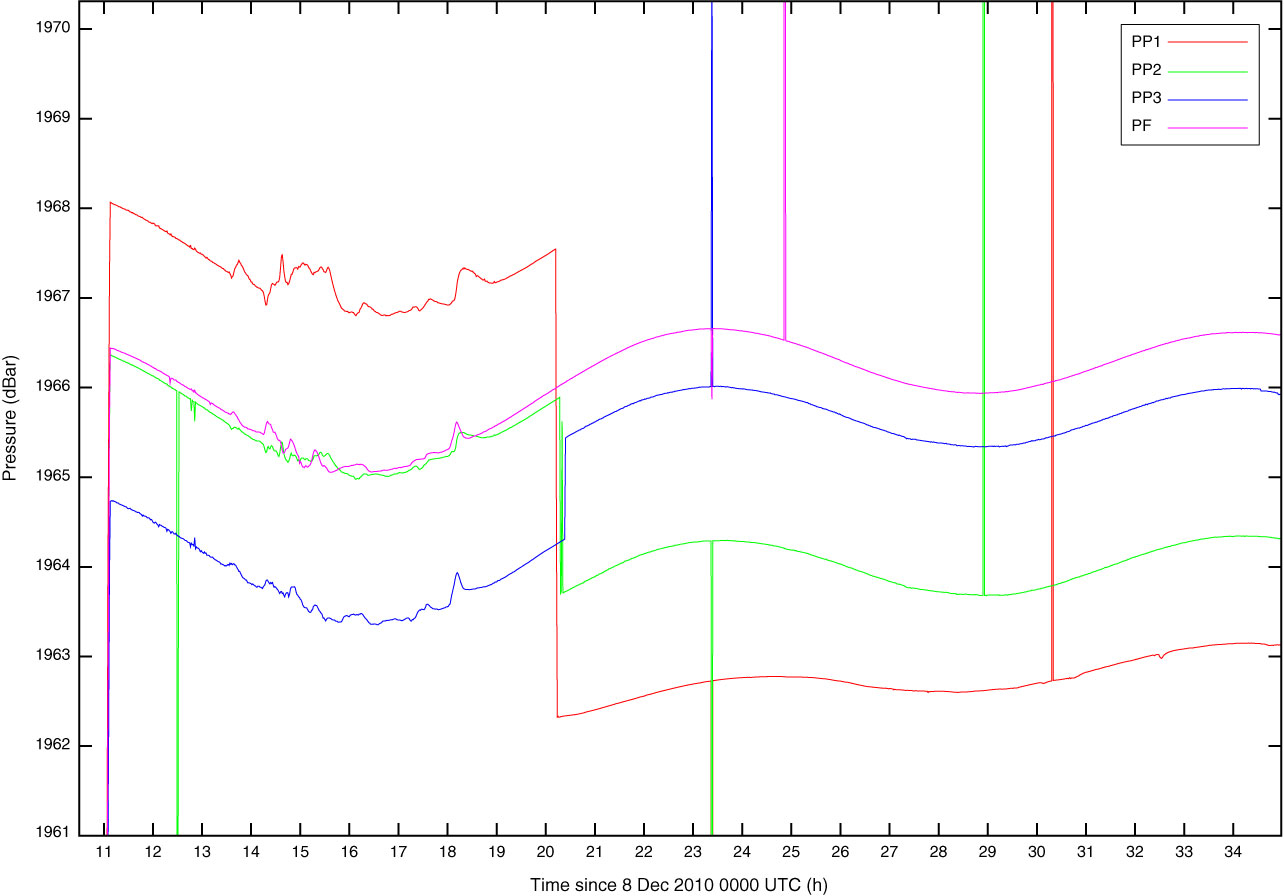
Figure F16. Initial pressure data from Site C0002 CORK observatory during cementing and after starting observation. Borehole pressure Ports PP1–PP3 from the bottom and seafloor pressure PF are shown.
Previous | Close | Next | Top of page