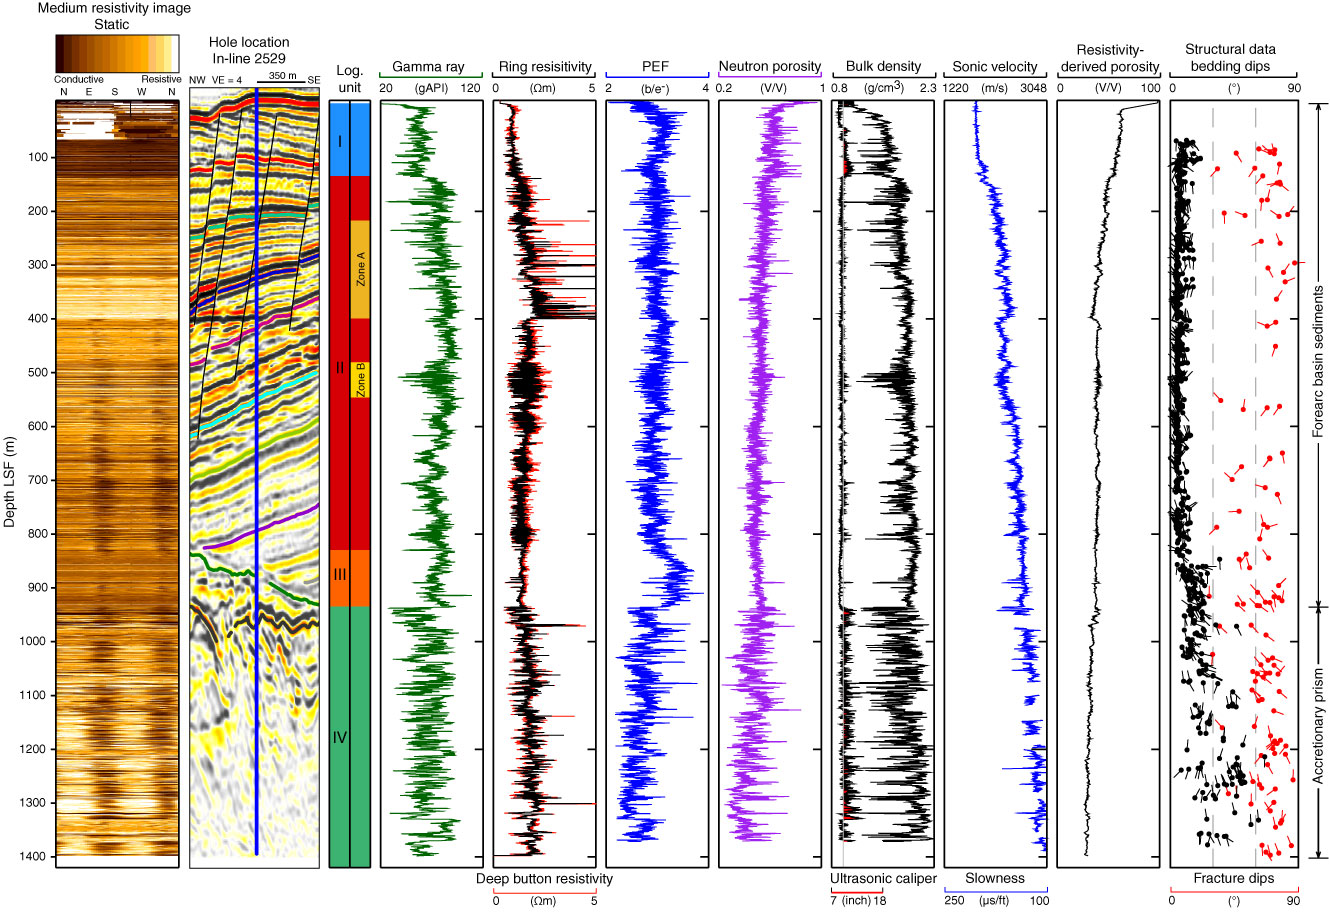
Figure F4. Summary log diagram at Site C0002 obtained during Expedition 314 (Expedition 314 Scientists, 2009). Bedding and fracture dips from resistivity at bit image. VE = vertical exaggeration, PEF = photoelectric effect. Black tadpoles = bedding, red tadpoles = fracture, tadpole line = dip direction of plane.
Previous | Close | Next | Top of page