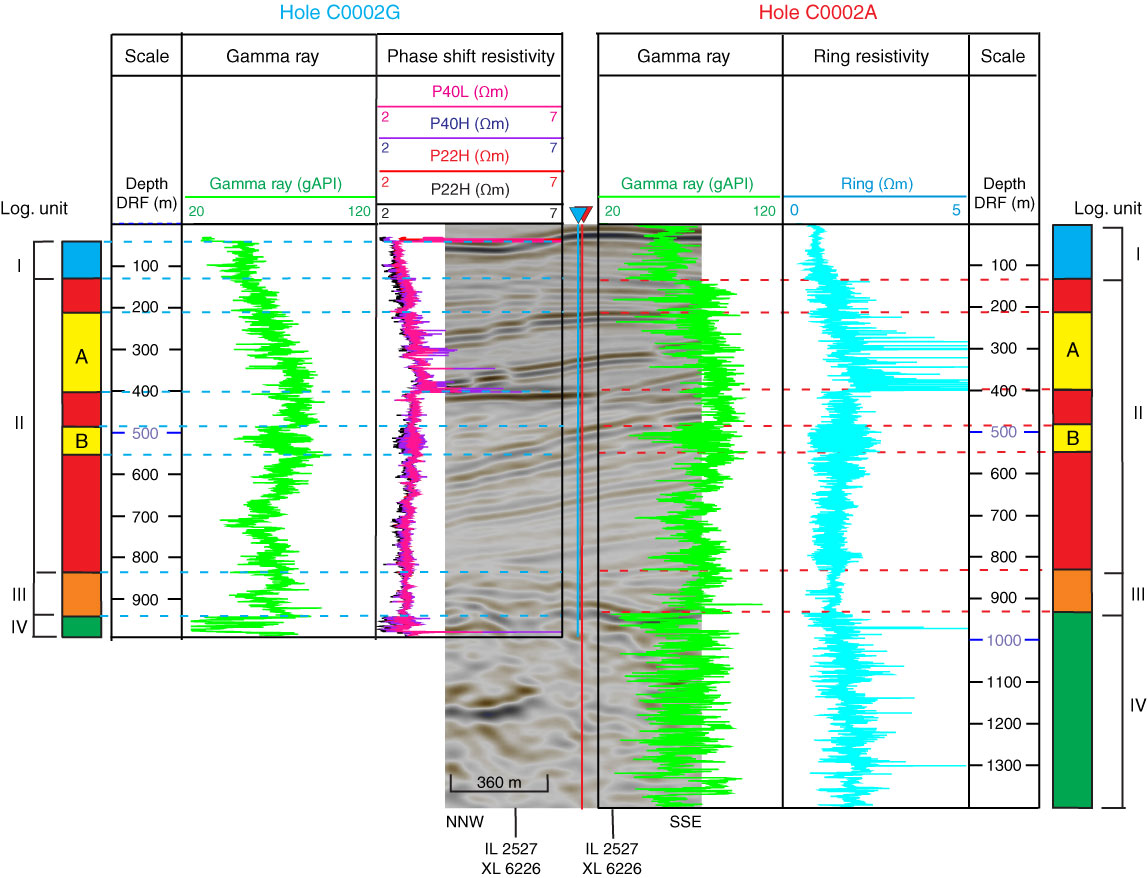
Figure F8. Correlation of LWD/MWD measurements from Holes C0002A and C0002G with 3-D seismic data set from Moore et al. (2007). Most of the transitions indicated by LWD/MWD data sets correspond to distinct amplitude changes of seismic layers (e.g., Unit II Zones A or B). Bottom of Zone A can be clearly attributed to the occurrence of a BSR, which is indicated by a remarkable increase in resistivity. The beginning of the accretionary prism in the seismic data is visible by chaotic, wavy reflectors, which corresponds to the highly oscillating curve progression in the LWD/MWD data sets. IL = in-line, XL = cross-line.
Previous | Close | Next | Top of page