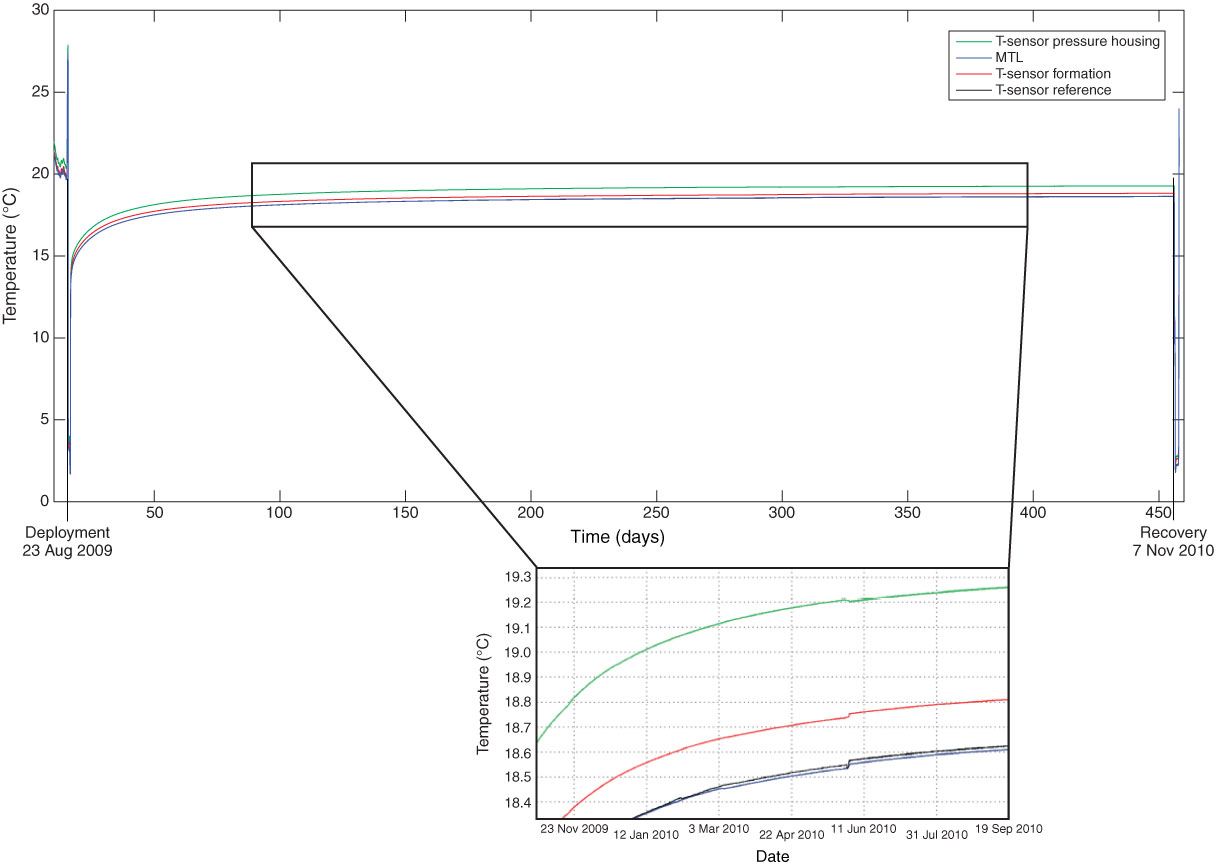
Figure F11. T record from platinum chip, MTL, and two P transducers. Main panel shows overview of temperature data obtained during the monitoring period, which was not sufficient to allow the temperature to reach in situ conditions. The strong variations and high amplitudes at the beginning and the end of the data are caused by deployment and recovery procedures, respectively. The data are otherwise free of any disturbance, except for the period highlighted in the inset. Here, it remains unclear what causes T to increase and decrease at the same point in time. Note that the P record does not show any anomaly at that time.
Previous | Close | Top of page