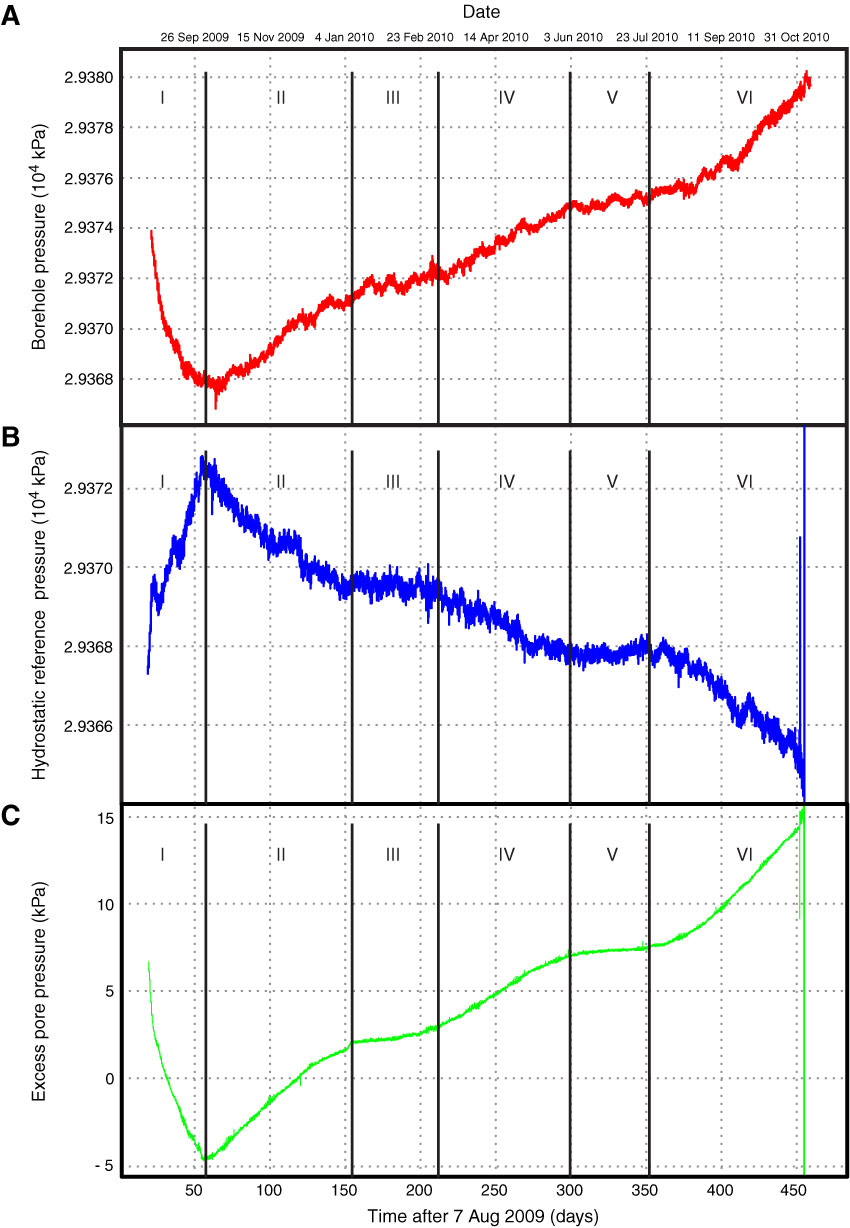
Figure F7. Overview of monitored (A) borehole pressure and (B) hydrostatic reference pore pressure as well as the resulting (C) excess pore pressure. The pressure evolution can be separated in six periods of different transient change rates (see text for details).

Previous | Close | Next | Top of page