Previous | Close | Next
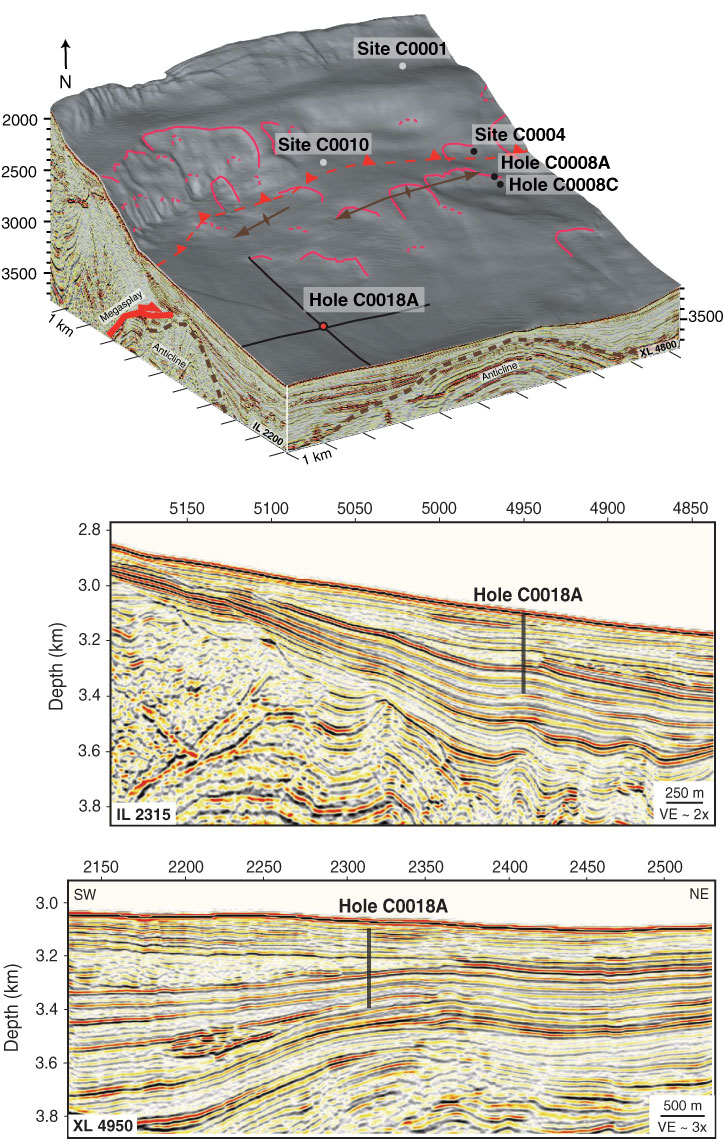
Figure F3. Detailed bathymetry and structure around Site C0018 at the footwall of the splay fault (Strasser et al., 2011). Block diagram and MCS cross-lines (XLs). IL = in-line, VE = vertical exaggeration.
Previous | Close | Next | Top of page