Previous | Close | Next
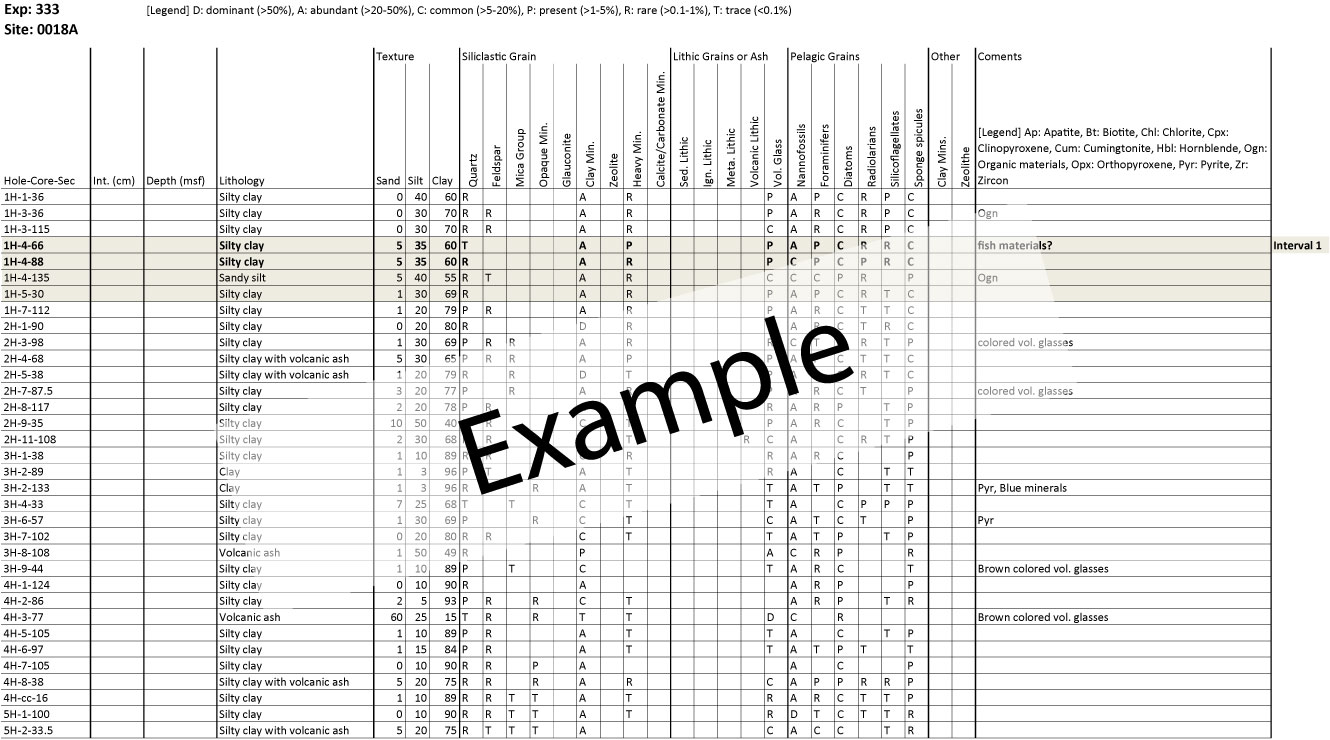
Figure F4. Smear slide data interpreted during Expedition 333. Indicated in the table are the core and section numbers, together with the relative depth from which smear samples were taken.
Previous | Close | Next | Top of page