Previous | Close | Next
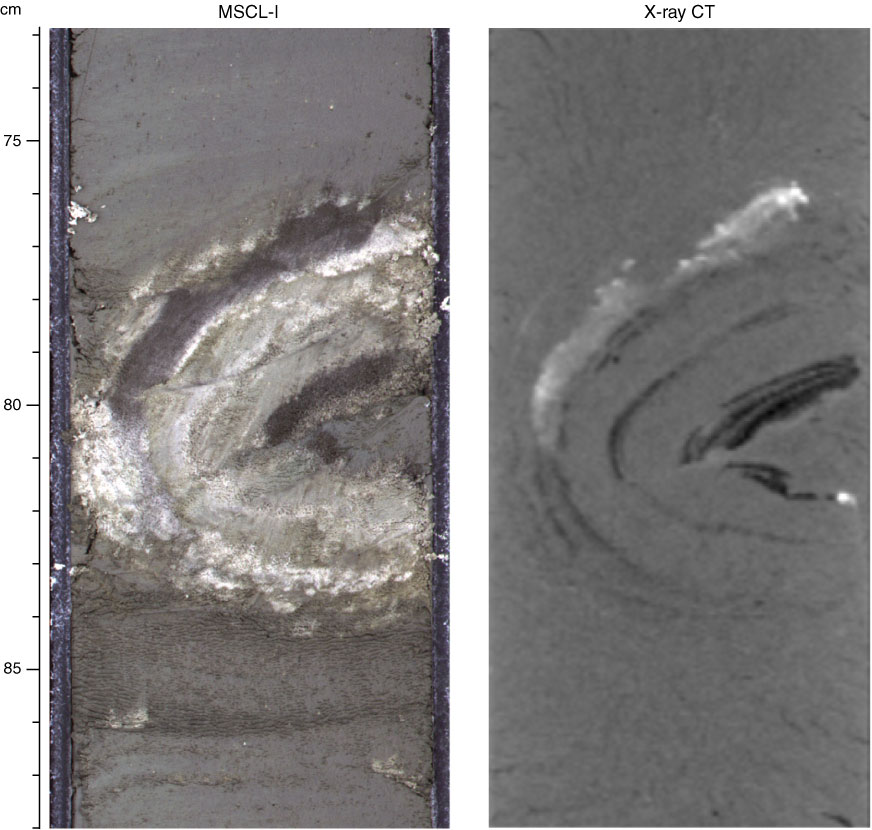
Figure F16. Appearance of a slump fold (interval 333-C0018A-5H-6, 76–84 cm). MSCL-I = photo image logger, CT = computed tomography.
Previous | Close | Next | Top of page