Previous | Close | Next
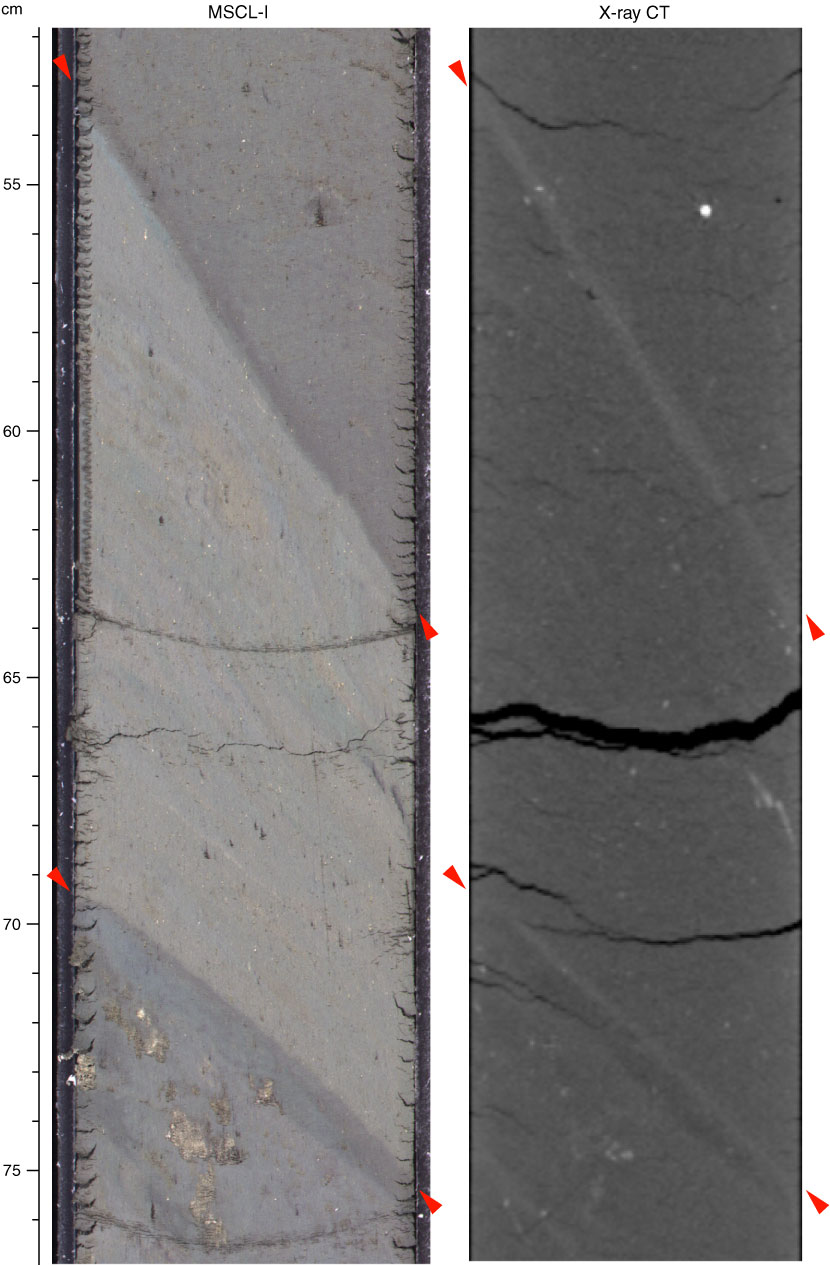
Figure F18. Appearance of shear zone (interval 333-C0018A-17H-6, 53–74 cm). Red triangles = location of shear zones. MSCL-I = photo image logger, CT = computed tomography.
Previous | Close | Next | Top of page