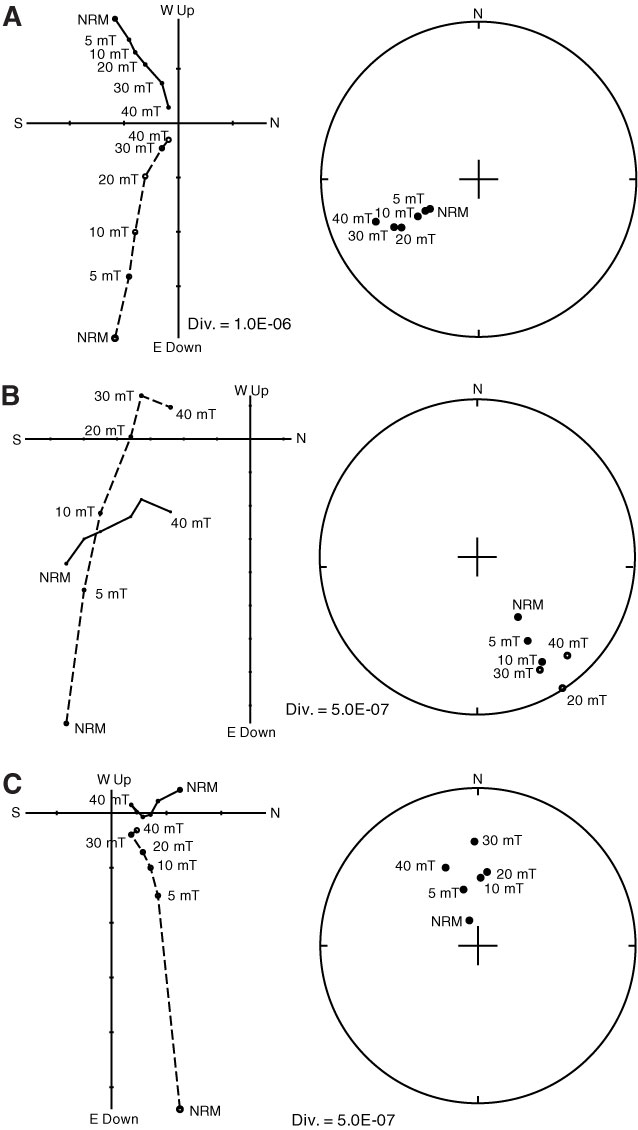
Figure F26. Zijderveld plots and stereonet magnetization directions (equal area lower hemisphere stereographic plot) showing results of AF demagnetization for sediments from (A) Sample 333-C0018A-29T-2, 12.0 cm (239.655 mbsf), (B) Sample 333-C0018A-33X-7, 84.0 cm (282.125 mbsf), and (C) Sample 333-C0018A-8H-7, 80.0 cm (68.418 mbsf). Black and white circles = projection of magnetization vector endpoint on horizontal and vertical planes, respectively, which is then plotted on a equal area lower hemisphere projection. Plots in the center bottom show magnetization of the samples that decrease as demagnetized. NRM = natural remanent magnetization.
Previous | Close | Next | Top of page