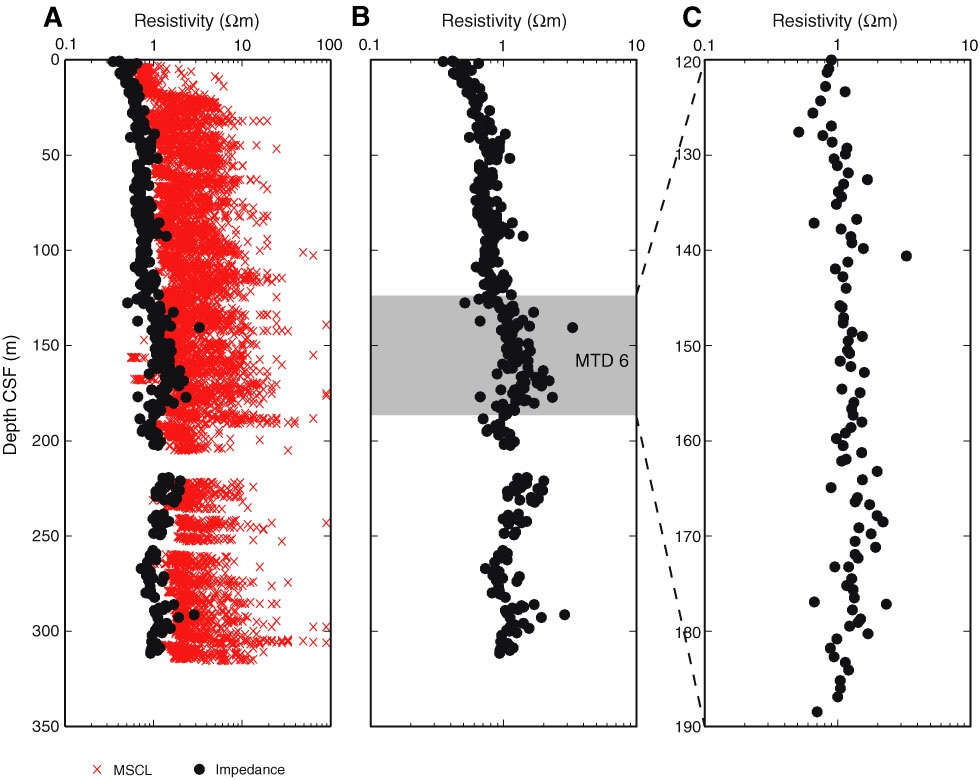
Figure F33. A. Measured resistivity (black) plotted with multisensor core logger (MSCL) resistivity (red), Site C0018A. B. Measured resistivity. Gray shading = mass transport deposit (MTD) 6. C. Plot of measured resistivity over the MTD 6 interval.
Previous | Close | Next | Top of page