Previous | Close | Next
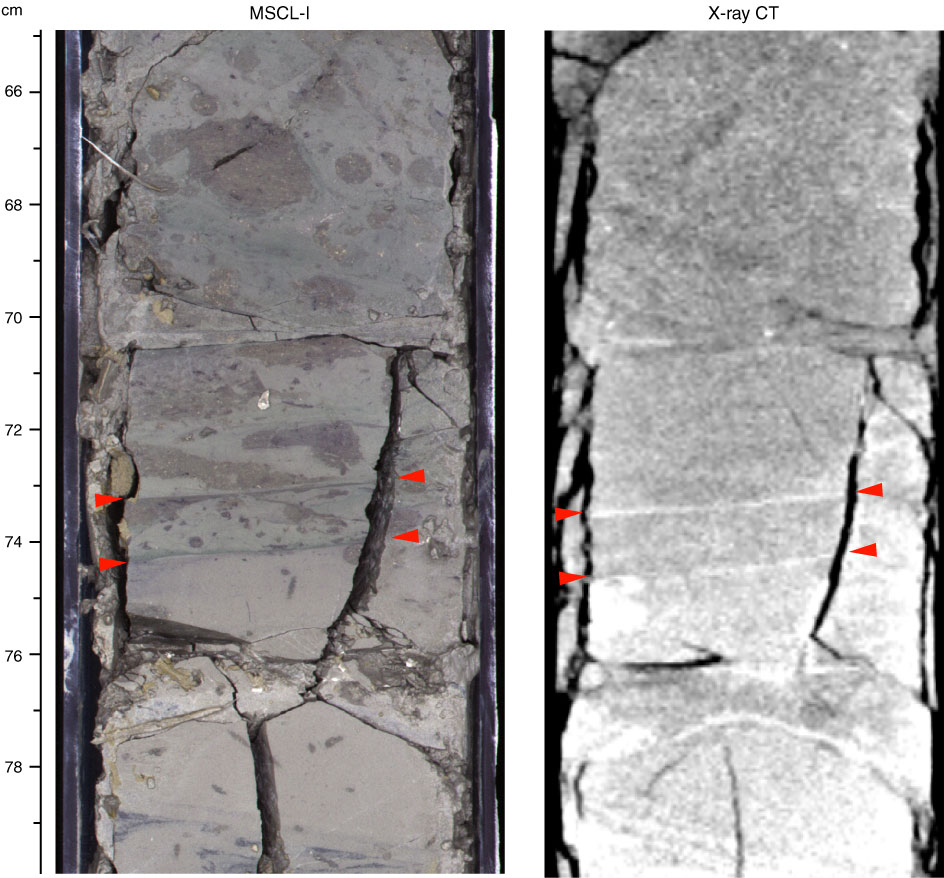
Figure F19. Appearance of low-angle healed fault (interval 333-C0011D-39X-3, 72–77 cm). Red triangles = localities of two faults. MSCL-I = photo image logger, CT = computed tomography.
Previous | Close | Next | Top of page