Previous | Close | Next
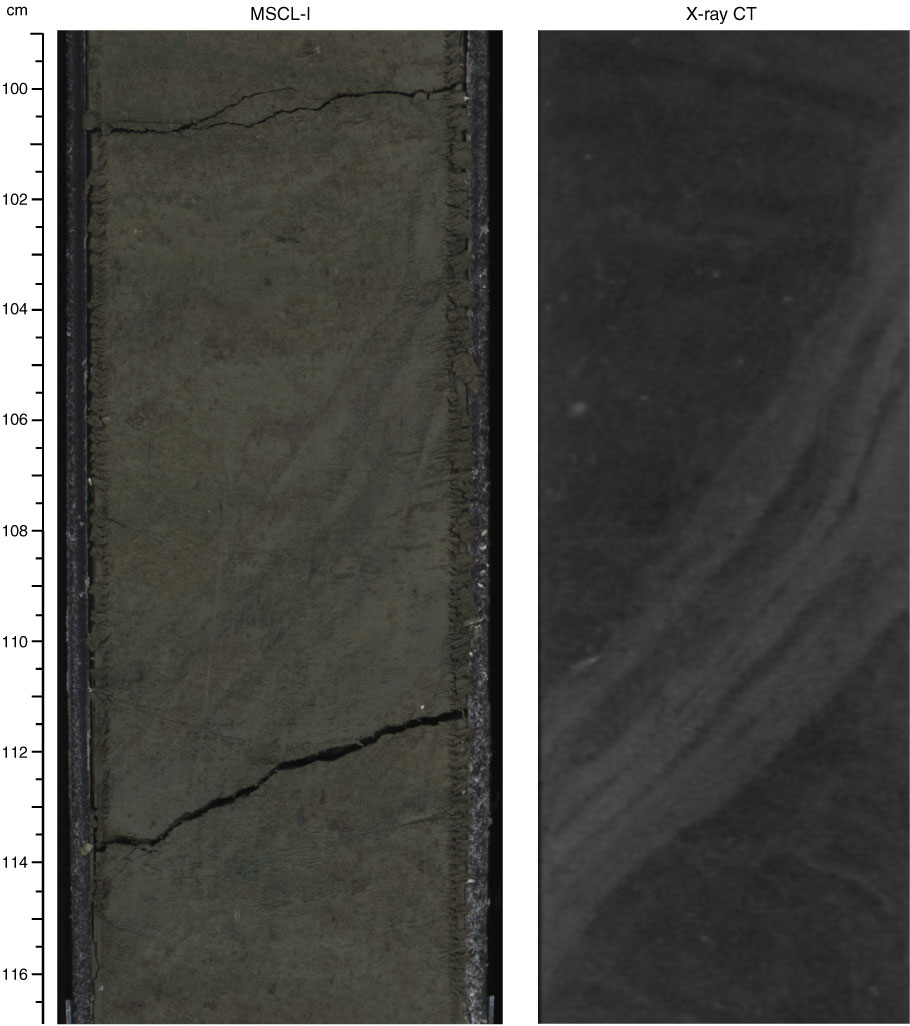
Figure F21. Appearance of shear zone (interval 333-C0011D-10H-4, 103–116 cm). MSCL-I = photo image logger, CT = computed tomography.
Previous | Close | Next | Top of page