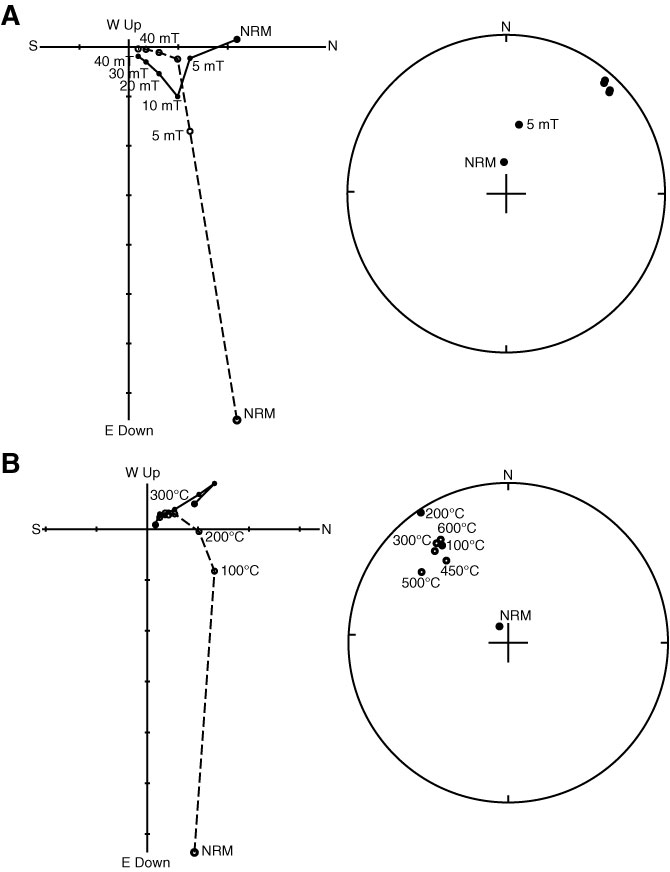
Figure F27. Zijderveld diagrams (Zijderveld, 1967) and Schmidt nets (in the lower hemisphere). A. Natural remanent magnetization (NRM) and remanent magnetization after 5, 10, 20, 30, and 40 mT AF demagnetization at 30.001 mbsf (Sample 333-C0011D-1H-9, 88–90 cm). B. NRM and remanent magnetization after 100°, 200°, 300°, 400°, 450°, 500°, 550°, and 600°C thermal demagnetization at 306.69 mbsf (interval 333-C0011D-40X-3, 37–39 cm). On the Zijderveld diagram, open circles = inclination, solid circles = declination. In particular, angles of the inclination decrease from NRM to remanent magnetization after 40 mT AF demagnetization, indicating drilling-induced magnetization. On the Schmidt nets, open circles = upward plots, solid circles = downward plots.
Previous | Close | Next | Top of page