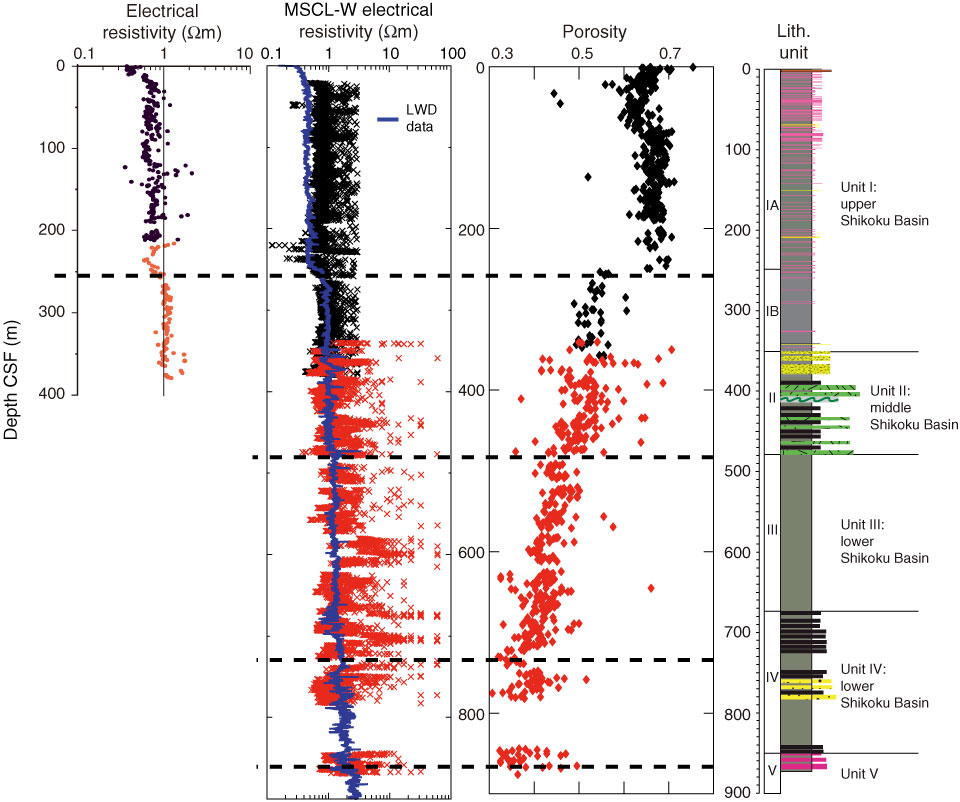
Figure F36. Resistivity measurements made on split sections from Site C0011 plotted with whole-round multisensor core logger (MSCL-W) resistivity and porosity from MAD measurements. Dashed lines = Expedition 322 Site C0011 logging units, black = Hole C0011C/C0011D, red = Expedition 322 Hole C0011B.

Previous | Close | Next | Top of page