Previous | Close | Next
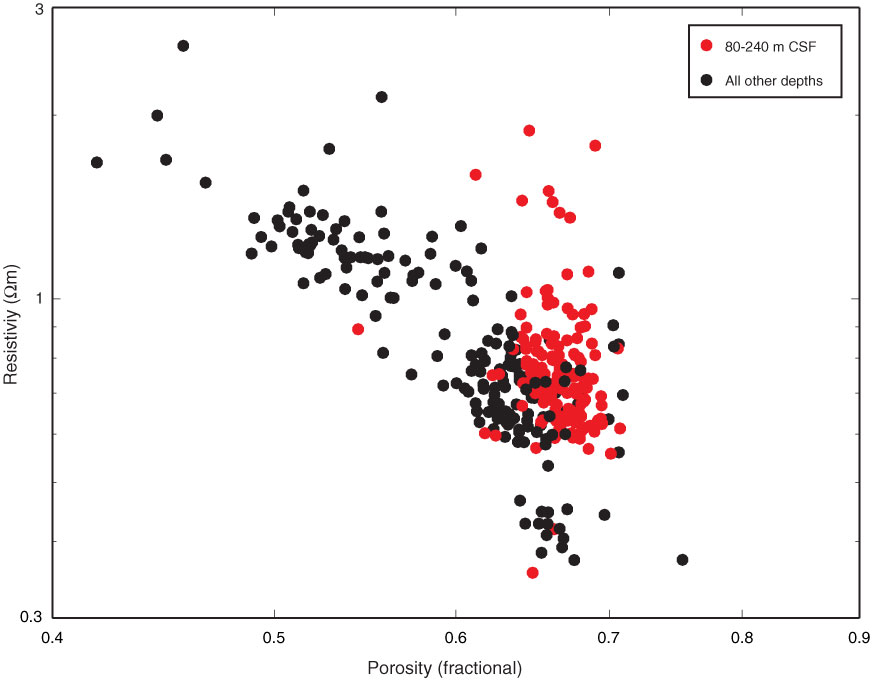
Figure F38. Log-log plot of porosity and resistivity, Holes C0011C and C0011D. Red = data from zone of anomalously high porosity from 80 to 240 m CSF.
Previous | Close | Next | Top of page