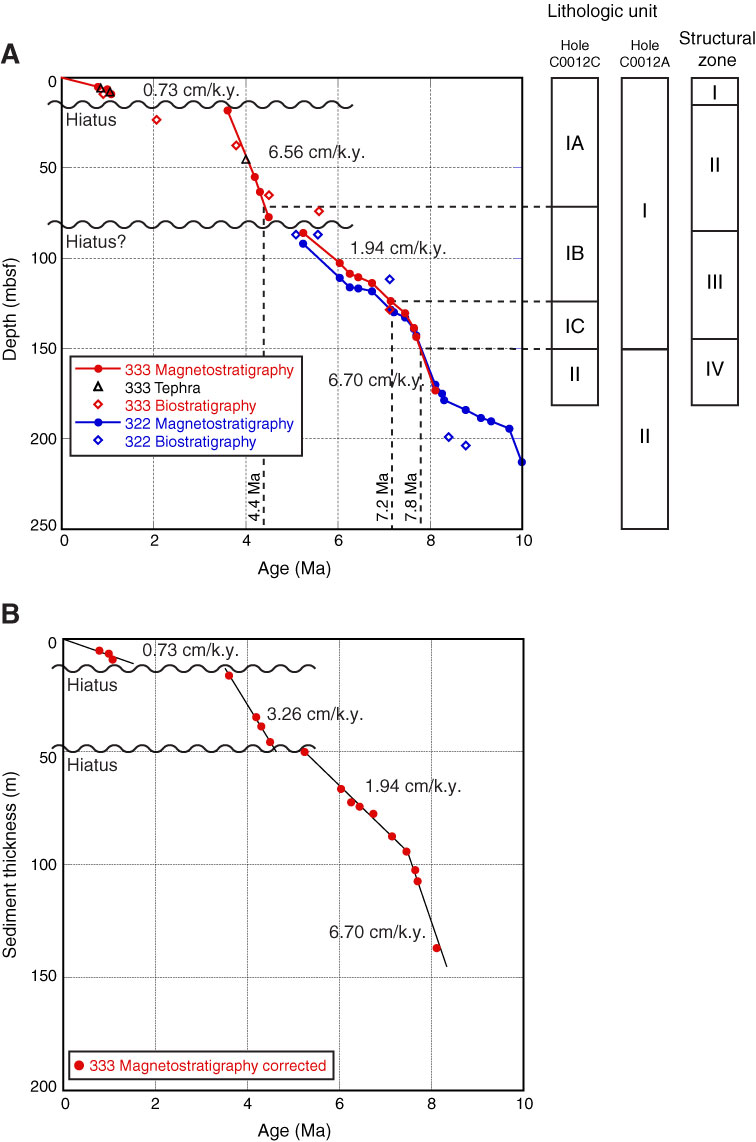
Figure F25. Geologic age vs. depth charts indicating sedimentation rate, Site C0012. Expedition 322 magnetostratigraphy Model A for the overlapped interval agrees with Expedition 333 age model. A. Age-depth diagram showing sedimentation rate based on apparent thickness of bedding. B. Age-true thickness diagram indicating sedimentation rate after correction for bedding dip.
Previous | Close | Next | Top of page