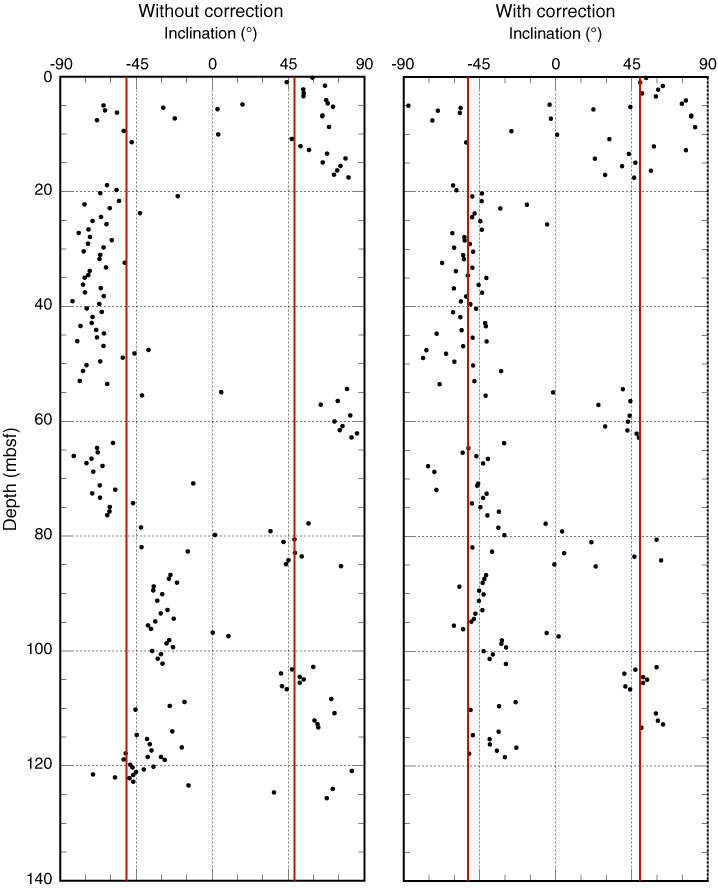
Figure F30. Inclination data after 30 mT AF demagnetization before and after bedding correction, Site C0012. Prior to bedding correction, inclination values are highly variable, but following bedding correction, data are more clustered around the expected value of ±52° (red lines). Chron and subchron boundaries are not affected by bedding correction.
Previous | Close | Next | Top of page