Previous | Close | Next
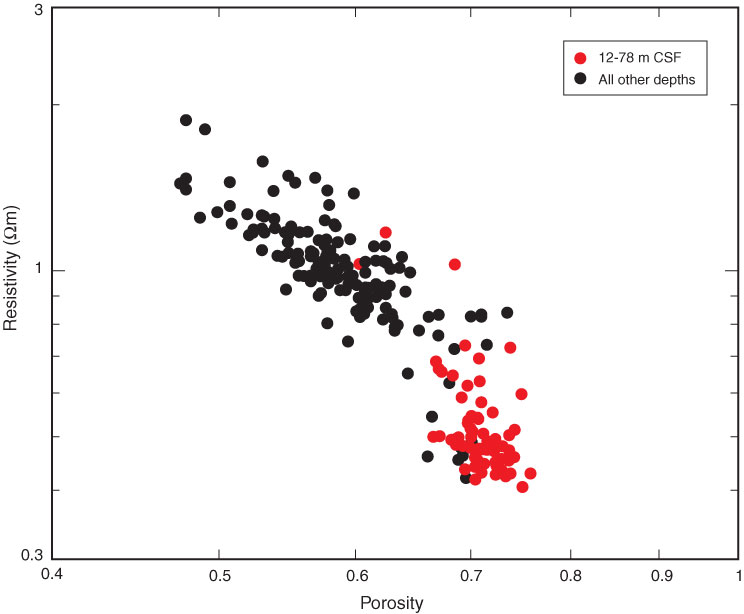
Figure F39. Measured resistivity data as a function of MAD-derived porosity, Site C0012. Red = anomalously high porosity data from 12 to 78 m CSF.
Previous | Close | Next | Top of page