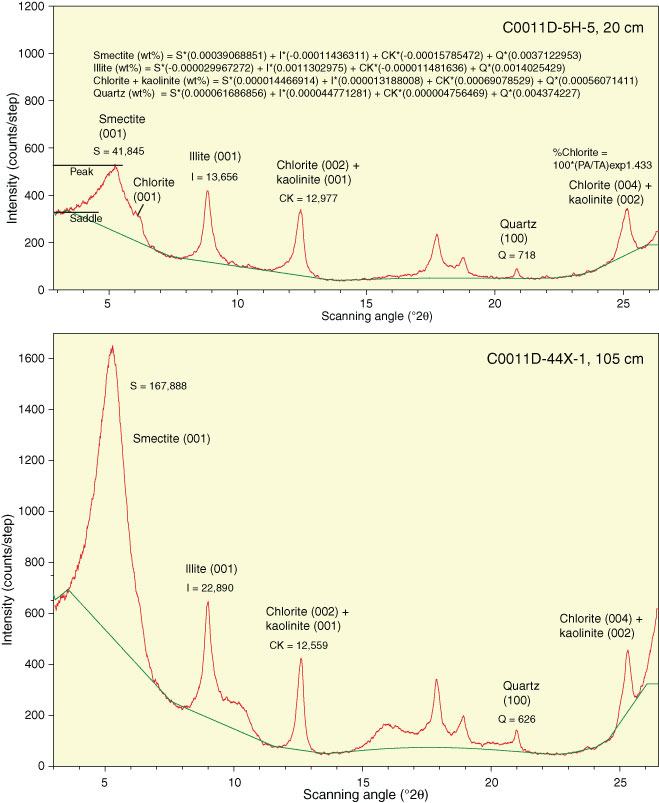
Figure F3. X-ray diffractograms of two representative clay-size specimens, Expedition 333. Values of integrated peak area (total counts) are shown above the diagnostic peaks. Also shown is an example of the computation array using SVD normalization factors from Set 2 (see Table T1). S = smectite, I = illite, CK = chlorite + kaolinite, Q = quartz. PA = 2× half-peak area for chlorite (004), TA = total peak area for composite chlorite (004) + kaolinite (002).
Previous | Close | Next | Top of page