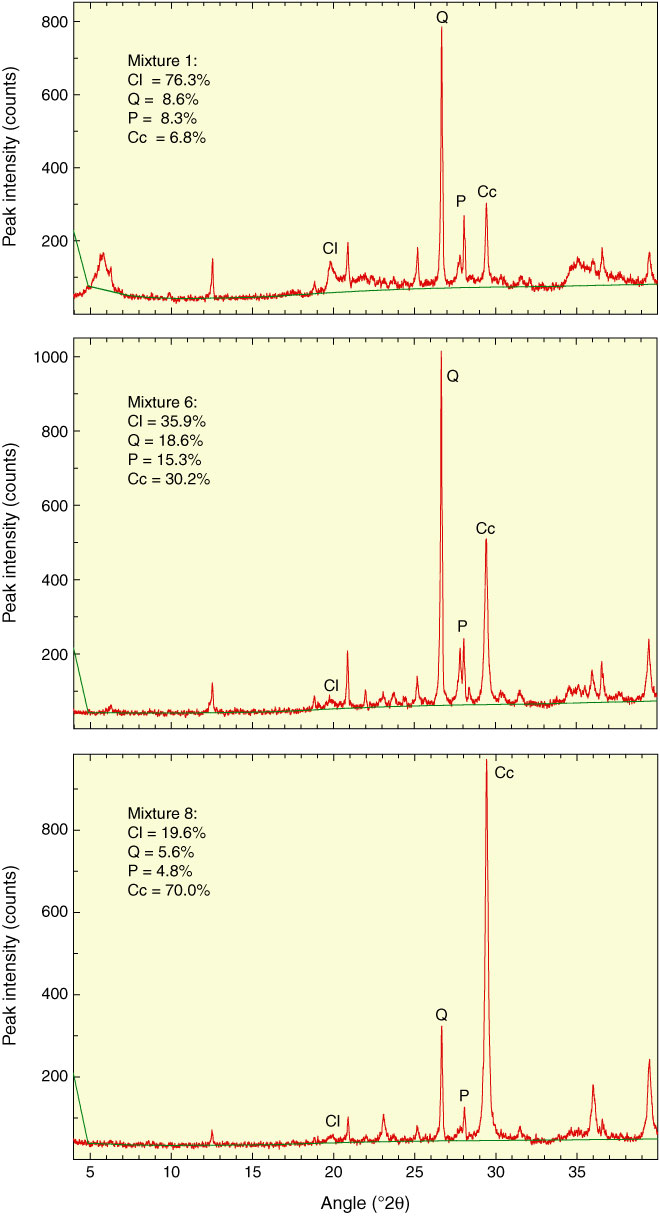
Figure F2. Diffractograms of mixtures of standard minerals showing positions of diagnostic XRD peaks used to calculate relative mineral abundances. Cl = total clay minerals, Q = quartz, P = plagioclase, Cc = calcite.

Previous | Close | Next | Top of page