Previous | Close | Next
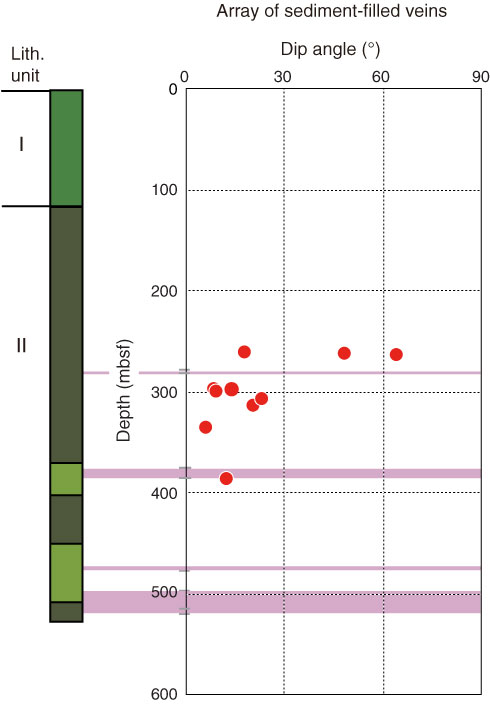
Figure F14. Plot of vein array dips as a function of depth, Site U1378. Shaded bands indicate four fault zones recognized in the slope sediments.
Previous | Close | Next | Top of page