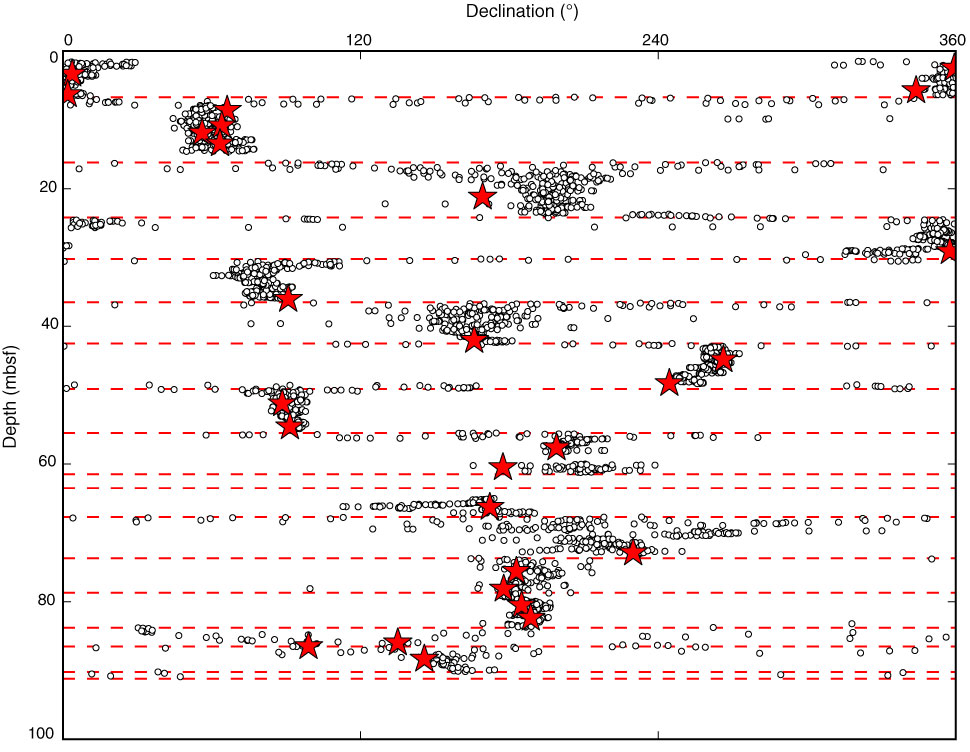
Figure F38. Plot of declination variations of paleomagnetic measurements on archive sections after 30 mT AF demagnetization for APC cores, Hole U1379C. Red stars indicate characteristic remanent magnetization of discrete samples, and dashed red horizontal lines represent core boundaries.
Previous | Close | Next | Top of page