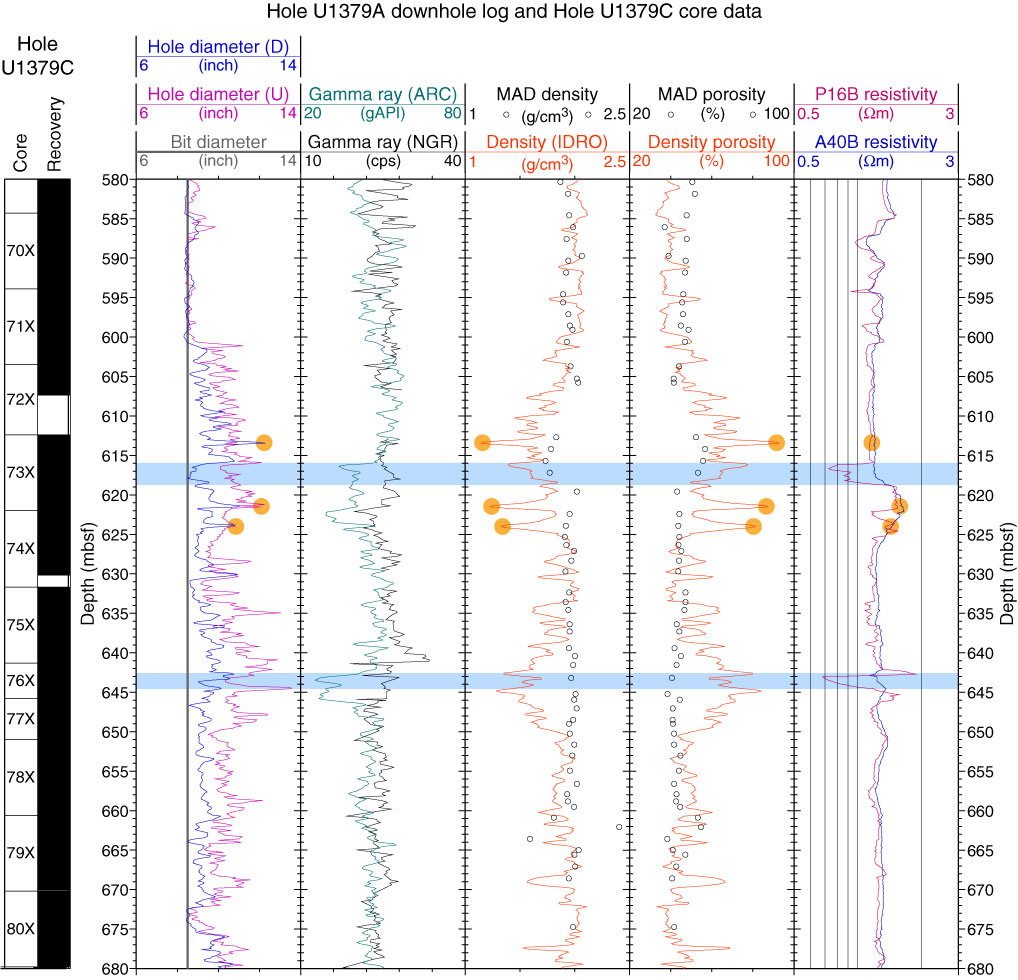
Figure F45. Comparison of LWD log data in Hole U1379A (colored curves) and core measurements in Hole U1379C (black curves and circles). D = hole diameter from density measurements, U = hole diameter from ultrasonic measurements, ARC = arcVISION tool, NGR = natural gamma ray core measurement, MAD = moisture and density core measurement, IDRO = image-derived density (adnVISION tool), P16B = phase-shift resistivity measured at a 16 inch source–receiver separation, A40B = attenuation resistivity measured at a 40 inch source–receiver separation. Orange circles indicate low density peaks in the logs that are most likely due to matching borehole enlargements. Blue shaded intervals highlight low logged densities that correspond to low resistivities.
Previous | Close | Top of page