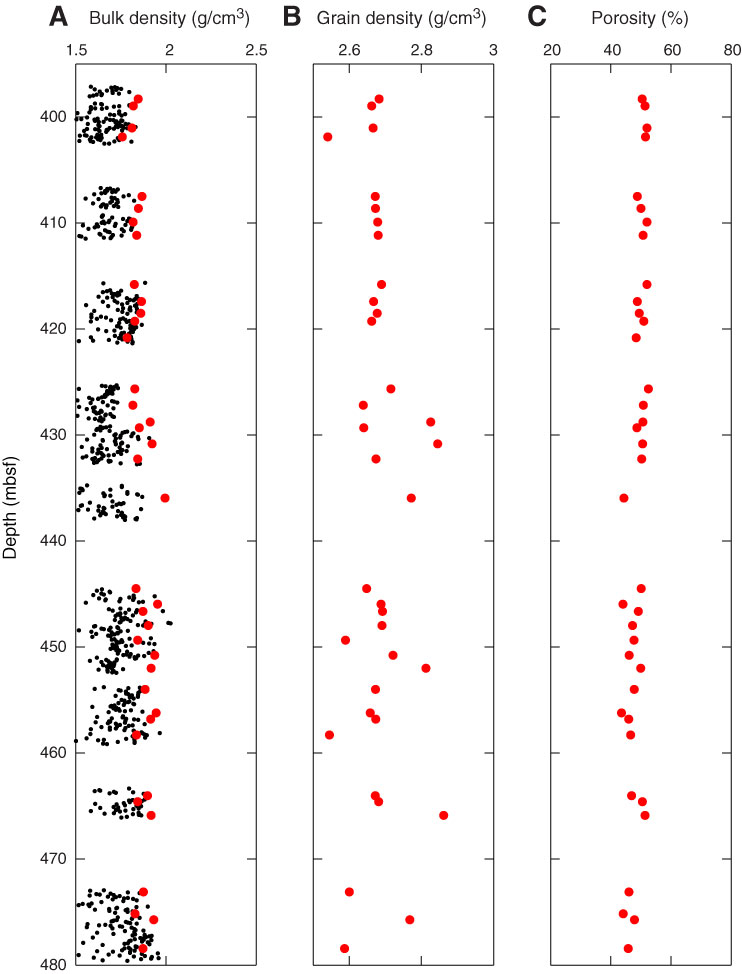
Figure F10. Plots of combined results of density and porosity measurements, Site U1380. A. Gamma ray attenuation density measured on the Whole-Round Multisensor Logger (black circles) and wet bulk density measured on discrete samples using the mass/volume method (red circles). B. Grain density measured on discrete samples using the moisture and density (MAD) mass/volume method. C. Porosity determined using MAD Method C.

Previous | Close | Next | Top of page