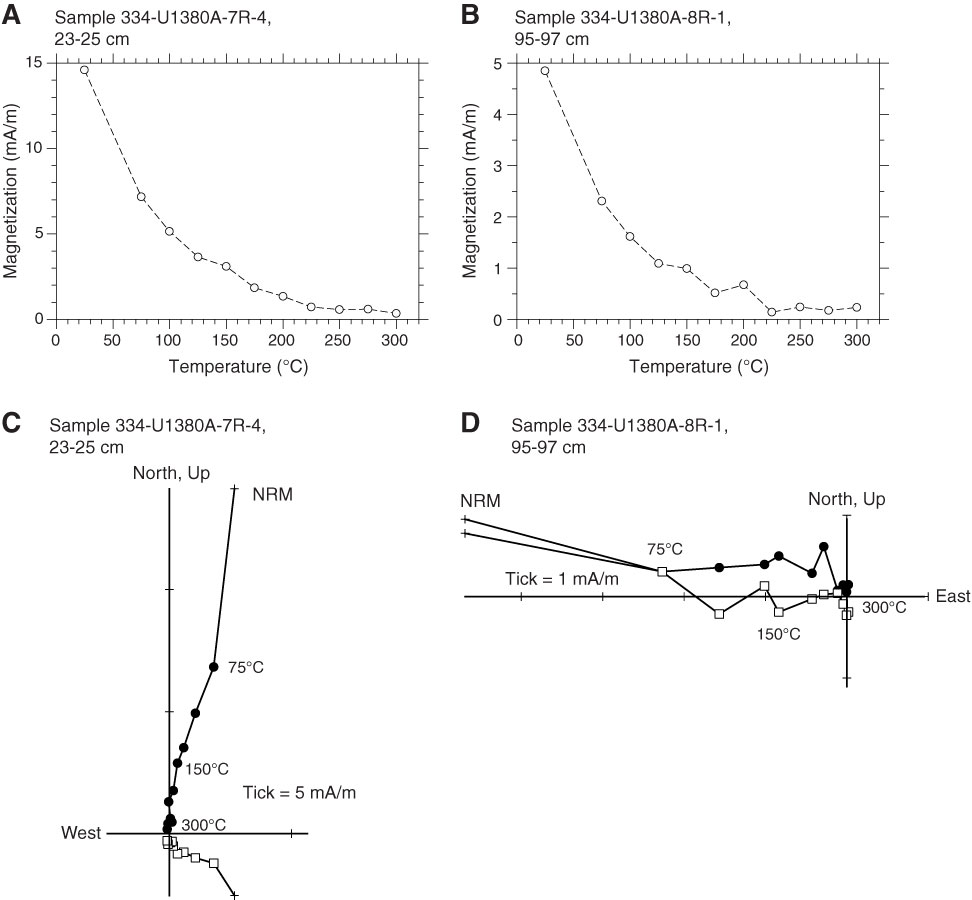
Figure F18. Diagrams of behavior of two discrete samples during stepwise thermal demagnetization. A, B. Magnetization intensity vs. temperature, showing steady decrease in natural remanent magnetization (NRM) intensity through progressive thermal demagnetization. C, D. Vector endpoint diagrams (Zijderveld, 1967) during thermal demagnetization. Characteristic remanent magnetization component is isolated after 150°C demagnetization. Open squares and solid circles represent the projection of the magnetization vector endpoints onto the vertical and horizontal planes, respectively.
Previous | Close | Top of page