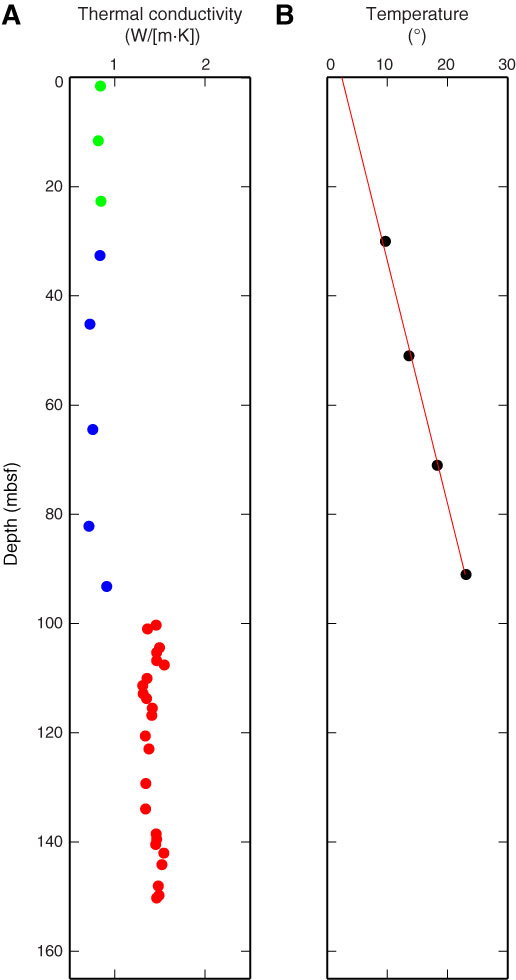
Figure F18. Plots of thermal data, Site U1381. A. Thermal conductivity values as a function of depth. Blue = needle-probe measurements in Hole U1381A, red = half-space measurements, green = needle-probe measurements in Hole U1381B. B. Equilibrium temperatures. Gradient (line) is best fit to data in least-squares sense.
Previous | Close | Next | Top of page