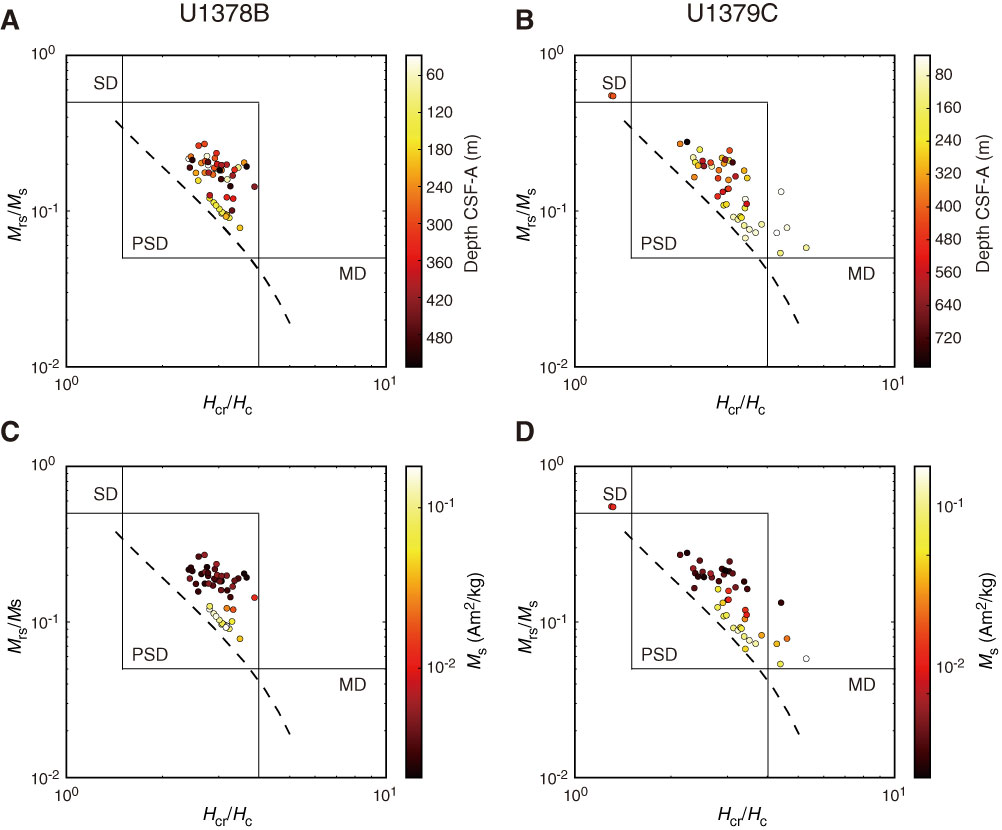
Figure F2. Day plots showing interrelationship among rock magnetic parameters, Holes U1378B and U1379C. Magnetic domain boundaries defined by Day et al. (1977) are shown. Dotted lines = theoretical single-domain (SD)–multidomain (MD) mixing line of titanomagnetite (Dunlop, 2002). PSD = pseudosingle domain. Color bars indicate (A, B) depth or (C, D) saturation magnetization. Note that the color scales for C and D are inverted relative to those for A and B.
Previous | Close | Next | Top of page