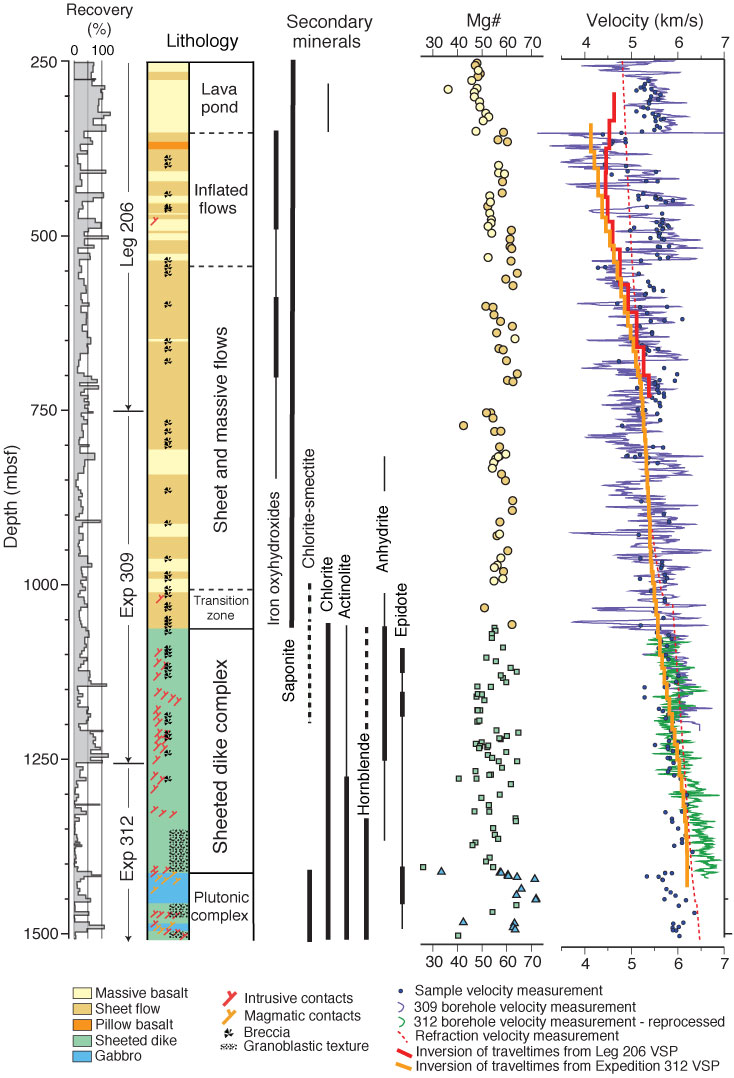
Figure F12. Summary lithostratigraphic column of the basement drilled at Site 1256 at the end of Expedition 312 showing recovery, major lithologies, downcore index alteration mineral distribution (thick lines = abundant, thin lines = rare, dashed lines = irregular; Teagle, Alt, Umino, Miyashita, Banerjee, Wilson, and the Expedition 309/312 Scientists, 2006, updated by Alt et al., 2010), downcore distribution of Mg# (where Mg# = 100 × Mg/[Mg + 0.9 × Fe]) atomic ratio (symbols follow colors in the lithostratigraphic column), and seismic velocity measured on discrete samples from wireline tools (Wilson, Teagle, Acton, et al., 2003; Teagle, Alt, Umino, Miyashita, Banerjee, Wilson, and the Expedition 309/312 Scientists, 2006; reprocessed data from Guérin et al., 2008) and from seismic refraction data (Wilson et al., 2003). Heavy red and orange lines show the inversion of traveltimes from Leg 206 and Expedition 312 vertical seismic profiles (VSPs), respectively (Swift et al., 2008).
Previous | Close | Next | Top of page