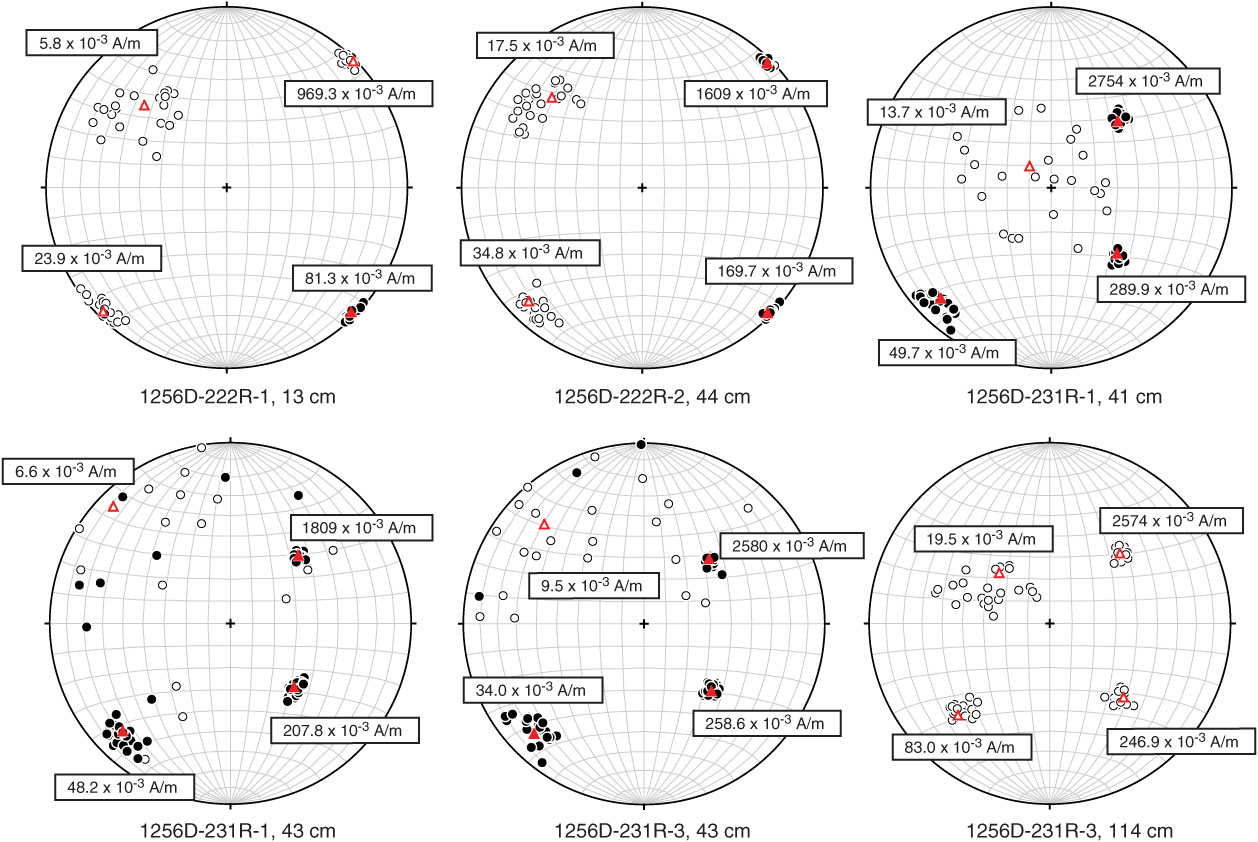
Figure F18. Equal area stereographic projections showing the distributions of remanence directions for individual samples measured in each of 24 positions on the superconducting rock magnetometer (SRM) at varying levels of remanence intensity, Hole 1256D. Note the increase in directional scatter as intensity decreases. Black symbols = SRM data, red symbols = AGICO JR-6A data used as a reference. Solid/open symbols represent directions on the lower/upper hemispheres, respectively.
Previous | Close | Next | Top of page