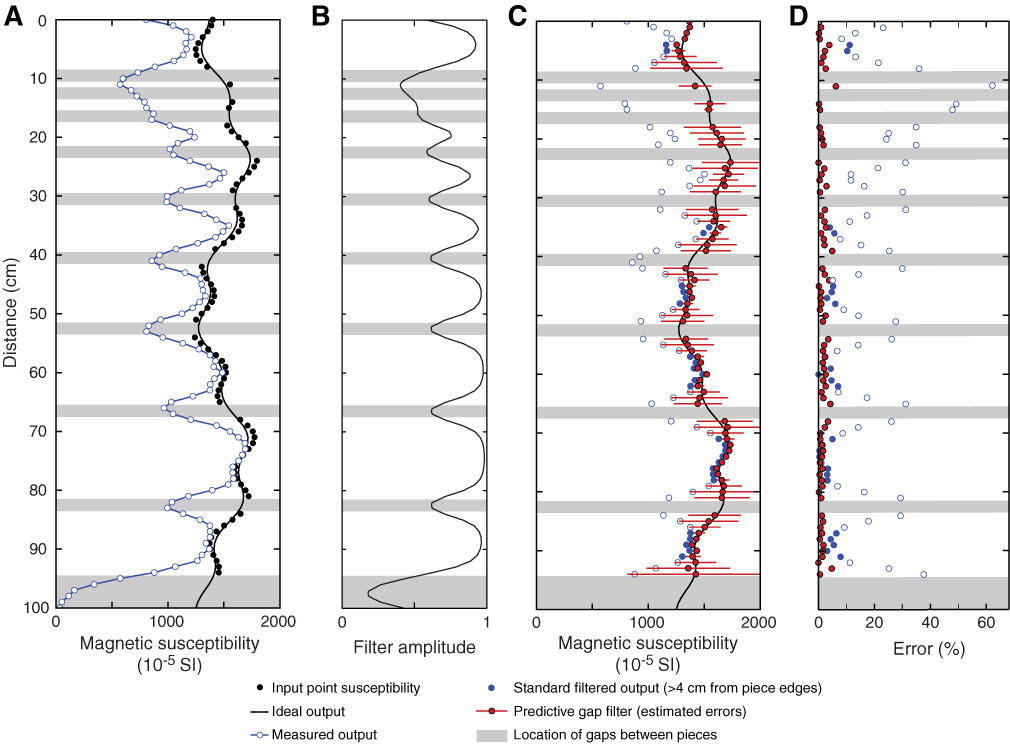
Figure F26. Synthetic test of gap filtering algorithm, Expedition 335. A. Input magnetic susceptibility (black circles) defined as a function of offset (z) by κ(z) = 1500 – 200cos(πz/25) + 100cos(0.17πz). Ideal output susceptibility (black line) defined by convolving κ(z) with the instrument response curve (Fig. F20). Measured output (open blue circles and blue line) defined by setting the input function to zero at gaps and convolving with the instrument response curve; random Gaussian noise with 10 nT standard deviation is added to the computed data. B. Amplitude of the predictive gap filter. C. Results of gap filtering; all data from gaps have been removed. Ideal output and measured output as in A; results of culling data <4 cm from piece edges (solid blue circles) and deconvolving data (red circles) using the predictive gap filter shown in B. Error bars are calculated from the maximum variation associated with mislocating the gaps by 1 cm. D. Percentage error in the measured and filtered data. (See text for further discussion.)
Previous | Close | Next | Top of page