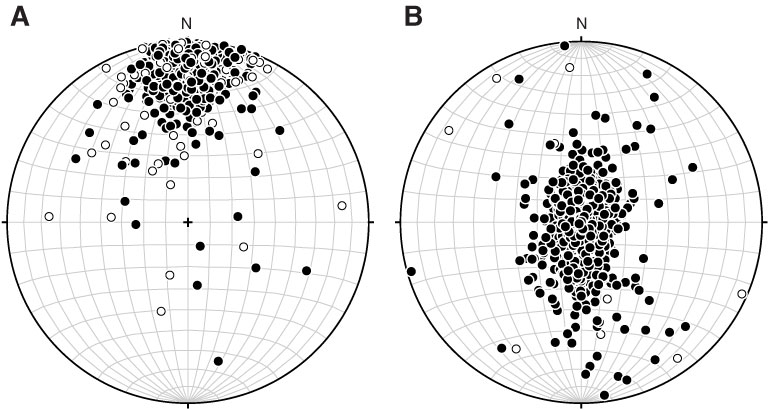
Figure F84. Equal-area stereographic projections showing instantaneous geomagnetic field directions calculated from 1000 realizations of the statistical field model TK03.GAD of Tauxe and Kent (2004) for the location of Hole 1256D. The distribution of these vectors predicts the variability of geomagnetic field directions at the site due to paleosecular variation. A. Data in the geographic reference frame. B. Data after rotation of the geocentric axial dipole direction to the vertical, demonstrating the north–south elongation in the distribution of predicted geomagnetic field directions. Data calculated for a normal polarity field only for clarity. Closed/open symbols indicate points on the lower/upper hemispheres, respectively.

Previous | Close | Next | Top of page