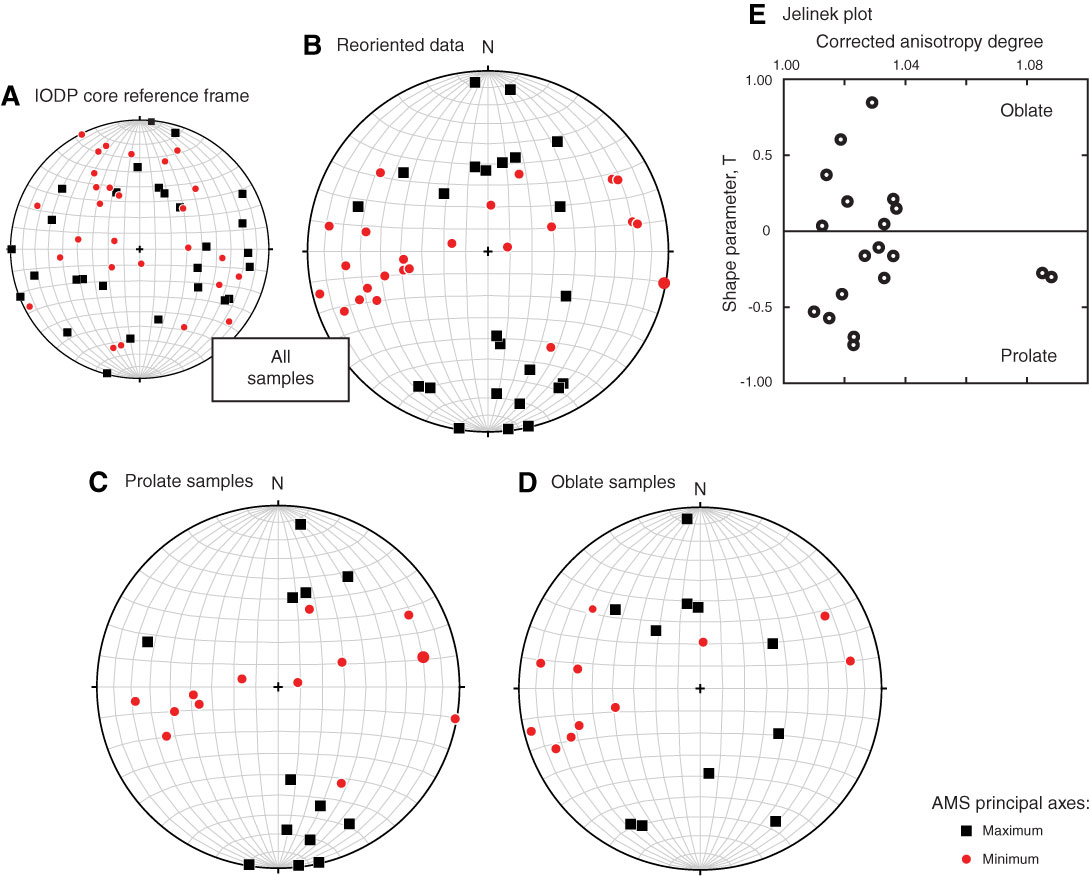
Figure F87. Summary plots of anisotropy of low-field magnetic susceptibility (AMS) data from discrete samples from Hole 1256D (top of Gabbro 1 downward). A. Data in the azimuthally unoriented IODP core reference frame. B. Data after restoration of characteristic remanent magnetization (ChRM) declinations to a common north (i.e., ignoring potential effects of paleosecular variation on the distribution of ChRMs). C. Samples with prolate AMS fabrics. D. Samples with oblate AMS fabrics. E. Jelinek plot of corrected anisotropy degree against shape parameter for all samples.

Previous | Close | Next | Top of page