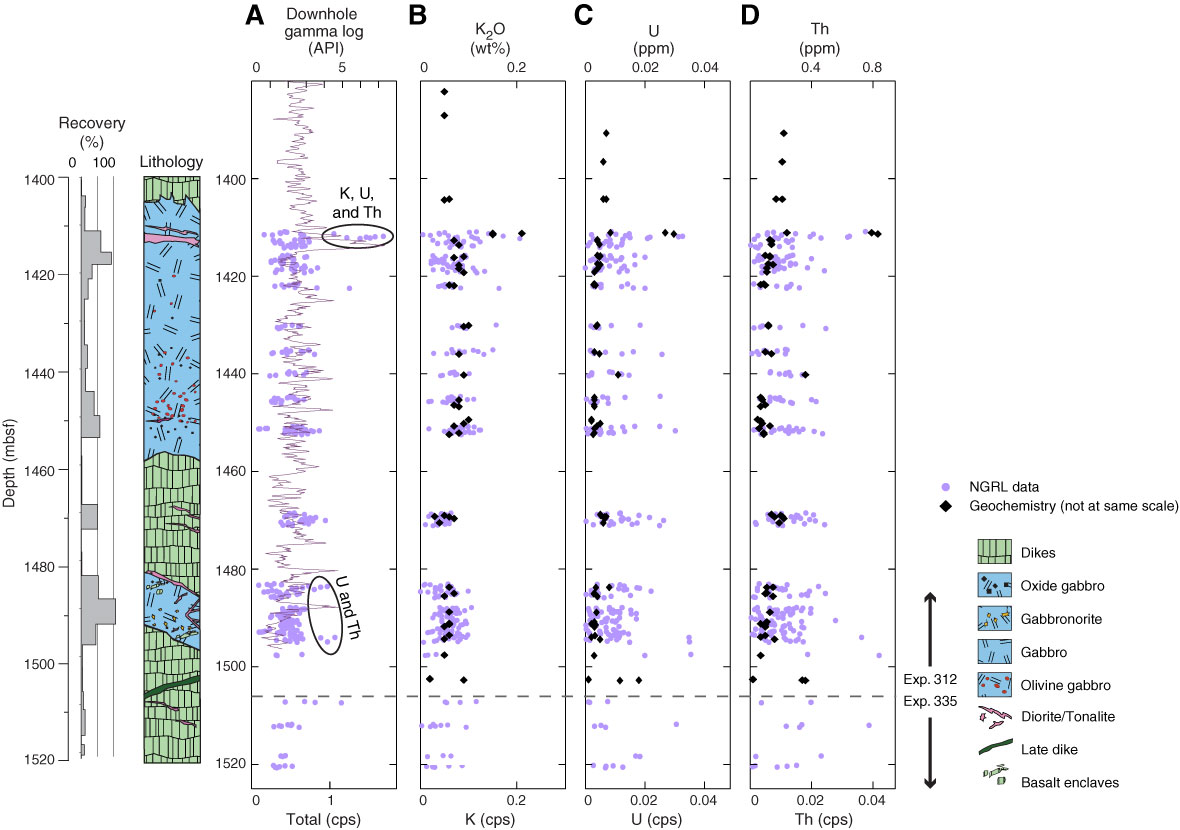
Figure F89. Results from the Natural Gamma Radiation Logger (NGRL) and observed concentrations of K, Th, and U measured after Expedition 312 (Gao et al., 2009; Neo et al., 2009; Yamazaki et al., 2009). A. Total counts from the NGRL. B. Counts in the K window and measured K2O (wt%). C. Counts in the U window (cps) and U concentrations (ppm). D. Counts in the Th window and Th concentrations (ppm). Note the scales are different.

Previous | Close | Next | Top of page